Figure 4.
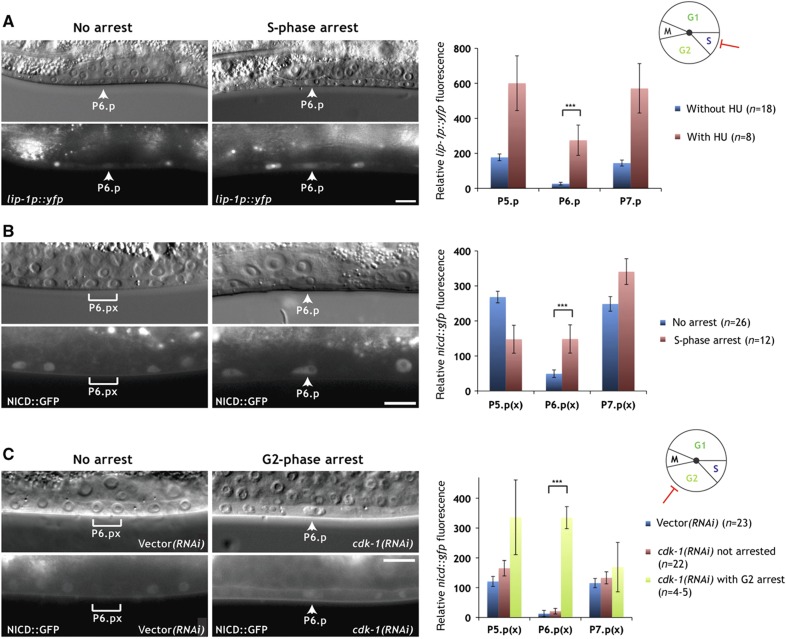
NICD is degraded during the G2 phase. (A) Expression of the 2° fate marker lip-1p::yfp persists in P6.p of a hydroxyurea (HU)-treated larva (arrowheads in the right panels), while expression is downregulated in an untreated control animal at the Pn.p stage (arrowheads in the left panels). (B) NICD::GFP persists in the undivided P6.p cell of a hydroxyurea-treated larva (arrowheads in the right panels), but NICD::GFP is downregulated in the P6.p descendants of an untreated control larva at the Pn.px stage (brackets in the left panels). (C) NICD::GFP persists in the G2-arrested P6.p cell of a cdk-1 RNAi-treated animal at the Pn.px stage (arrowheads in the right panels), while NICD::GFP is downregulated in the P6.p descendants of an empty vector RNAi-treated control animal (brackets in the left panels). Note that due to the incomplete penetrance of the cdk-1 RNAi effect, only P6.p had arrested in the example shown in the right panels. In all panels, the corresponding Nomarski images are shown on top. The scale bars represent 10 μm. Quantifications of lip-1p::yfp and NICD::GFP expression are shown to the right. Error bars indicate the standard error and asterisks indicate the significance as described in Materials and methods. Source data is available for this figure in the Supplementary Information.

