
Figure 4.
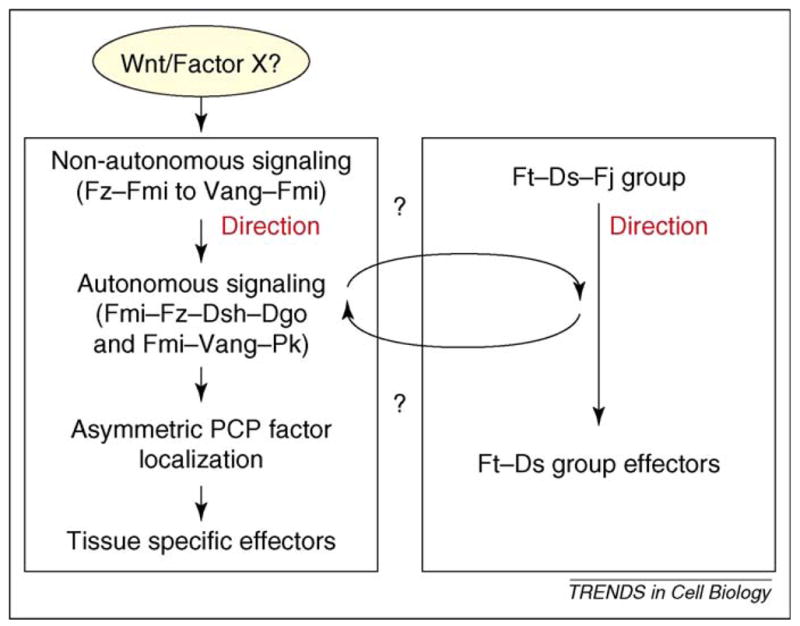
Summary of the relationships between the PCP signaling events. The diagram schematizes the relationships among the non-autonomous and autonomous Fz–Fmi core PCP signaling and Ft/Ds PCP signaling. The two core groups seem to act in parallel. The nature of Factor X to provide a polarization bias for the Fz–Fmi group (a Wnt or other) remains unknown.