Figure 1.
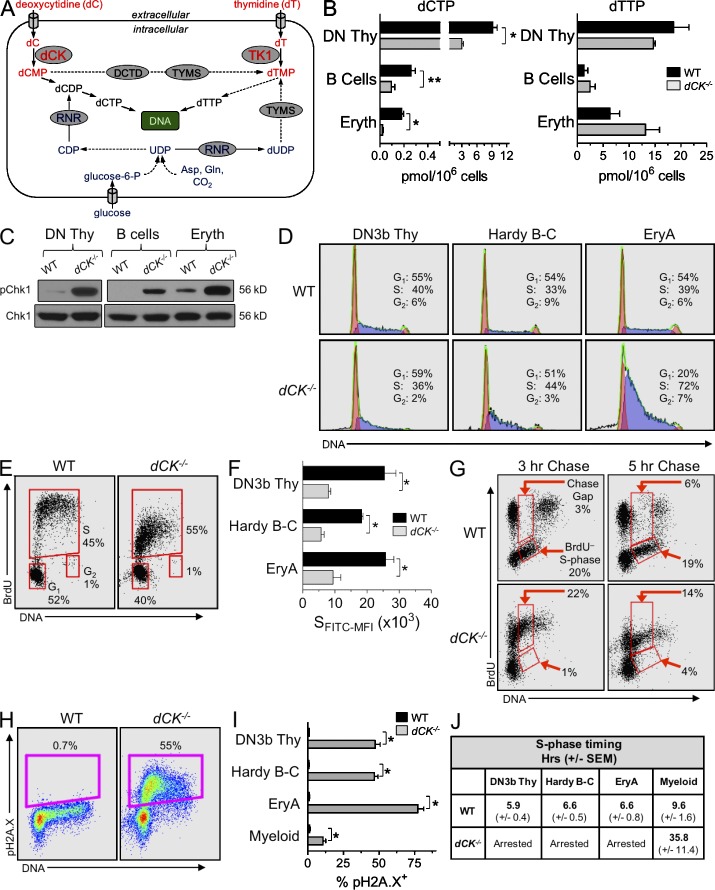
dCK inactivation causes severe RS in lymphoid and erythroid lineages. (A) Schematic of the de novo pathway (blue) and of the nucleoside salvage pathway (NSP, red) inputs into pyrimidine dNTP pools for DNA synthesis. Solid arrows indicate single-step processes; dashed arrows indicate multistep processes with intermediates not named/depicted in the schematic. Gln, glutamine; Asp, aspartate; UDP, uridine diphosphate; CDP, cytidine disphosphate; TYMS, thymidylate synthase; DCTD, dCMP deaminase; dCK, deoxycytidine kinase; TK1, thymidine kinase 1. (B) dCTP and dTTP pools in WT (black bars) and dCK−/− (gray bars) cells; DN Thy, CD4/CD8 double-negative thymocytes; B cells, BM-resident B cell progenitors; Eryth, BM-resident erythroid progenitors. Data are mean values ±SEM for three independent measurements generated from four pooled mice per genotype during each independent measurement. *, P < 0.003; **, P < 0.02. (C) Western blot detection of pChk1 (phosphorylated on Ser345) in lysates from lymphoid and erythroid progenitors. Total CHK1 protein was used as a loading control. (D) Representative examples of total DNA content staining and percentage of cells in the G1, S, and G2/M phases in WT and dCK−/− DN3b thymocytes, Hardy fraction B-C cells, and EryA cells. (E) Representative BrdU incorporation into WT and dCK−/− DN3b thymocytes 1 h after injection of BrdU. Percent of cells in G1, S, and G2 phases of the cell cycle are indicated. (F) Anti-BrdU FITC mean fluorescent intensities of S-phase cells (SFITC-MFI) from WT and dCK−/− DN3b thymocytes, Hardy fraction B-C cells, and EryA cells. Data are mean values ±SEM. n = 4 mice/genotype; *, P < 0.01. (G) Representative BrdU detection in WT and dCK−/− DN3b thymocytes after 3 and 5 h of BrdU chase (n = 4 mice/genotype). Percentages of cells present in chase gap and BrdU− S-phase gates are indicated. (H) Detection of H2A.X phosphorylated on Ser139 (pH2A.X) in DN3b thymocytes by flow cytometry. Percentages of pH2A.X-positive (pH2A.X+) cells are indicated. (I) Quantification of pH2A.X-positive staining in DN3b thymocytes, Hardy B-C cells, and EryA cells from WT (black bars) and dCK−/− (gray bars) mice. n = 7 mice/genotype; *, P < 0.0001. (J) S-phase durations, in hours, calculated using 5-h BrdU chase conditions in DN3b thymocytes, Hardy B-C cells, EryA cells, and BM-resident myeloid cells (CD11b+) from WT and dCK−/− mice. Data are mean values in hours ±SEM. n = 4 mice/genotype.

