Figure 4.
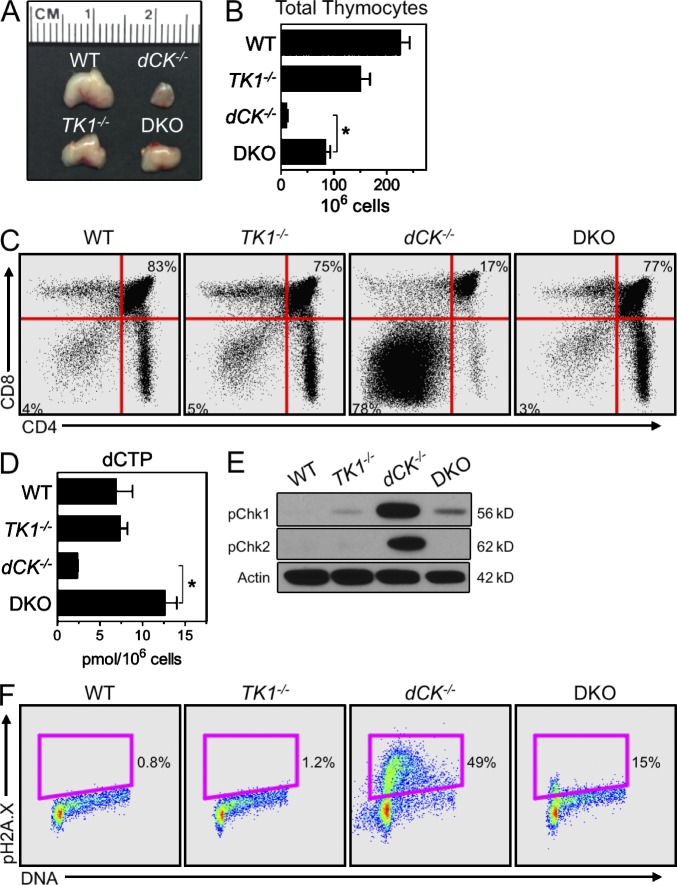
TK1 inactivation normalizes the development of dCK−/− T cells. (A and B) Gross thymus size (A), and total viable thymocytes recovered (B), from WT, dCK−/−, TK1−/−, and DKO mice. Data are mean values ±SEM. n = 5 mice/genotype; *, P < 0.001. (C) Representative example of CD4 and CD8 staining of total thymocytes from WT, dCK−/−, TK1−/−, and DKO mice. Percentages of DN thymocytes (bottom left gate) and DP thymocytes (top right gate) are indicated. (D) Measurements of dCTP pools in DN thymocytes isolated from WT, dCK−/−, TK1−/−, and DKO mice. Data are mean values ±SEM. n = 2 mice/genotype; *, P < 0.01. (E) Western blot detection of pChk1 and Chk2 phosphorylated on Thr68 (pChk2) in DN thymocytes. Actin was used as a loading control. (F) Representative examples of pH2A.X detection in DN3b thymocytes from WT, dCK−/−, TK1−/−, and DKO mice.

