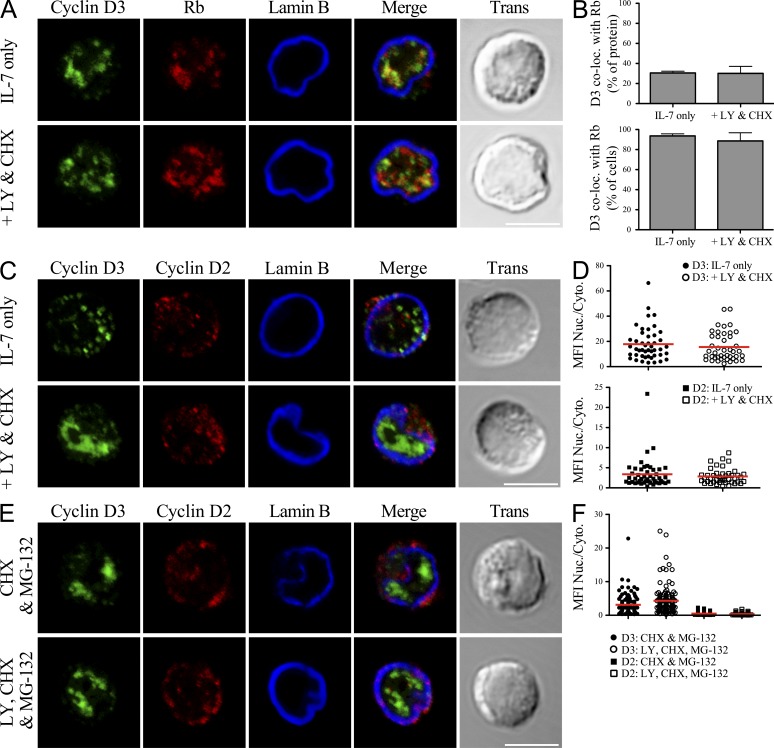
Figure 3.
Nuclear localization of cyclin D3 is not regulated by PI3K. (A–D) Rag2−/− pro–B cells were cultured in IL-7 alone or with LY294002 (LY) and CHX for 60 min. Cells were fixed, stained, and imaged for cyclin D3, Lamin B, and Rb (A) or cyclin D2 (C). (A and C) Representative single plane confocal images are shown, with merged channel and transmitted light images provided. Bars, 5 µm. (B) Quantification from images of cells treated as in A shown as percentage of detectable cyclin D3 colocalized with Rb (Manders’ coefficient, top) or percentage of cells scored positive for colocalization (at least 15% of cyclin D3 colocalized with Rb, bottom) with mean ± SD derived from three independent experiments. (D) Analysis of single cells treated as in C for the MFI of each protein presented as a ratio of signal detected in the nucleus versus the cytoplasm. Points represent individual cells analyzed across three experiments, with the red bar depicting the mean value for each population. Distribution of cyclin D2 compared with cyclin D3 was statistically different both before and after inhibitor treatment, P < 0.0001. (E and F) Rag2−/− pro–B cells were cultured in IL-7, CHX, and MG-132 ± LY for 60 min. (E) Cells were fixed, stained, and imaged for cyclin D3 and cyclin D2 as in C and F analyzed as in D. Bar, 5 µm. Comparison of cyclin D2 distribution ± LY, P < 0.001. Distribution of cyclin D2 and cyclin D3 was statistically different under both culture conditions, P < 0.0001.

