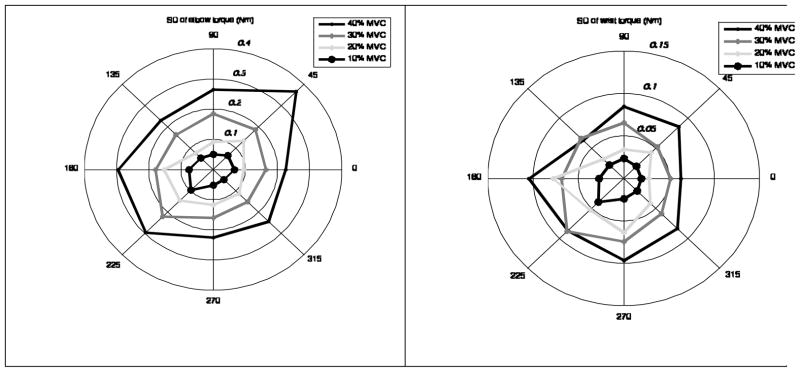
Figure 6.
Torque variability (SD) at the elbow and wrist joints in the trials at different target force levels and directions, group average data. Note the different scales in the two panels. The ratios ‘SD (elbow joint)/SD (wrist joint)’ for different target force levels varied between 3.1 and 3.4.

