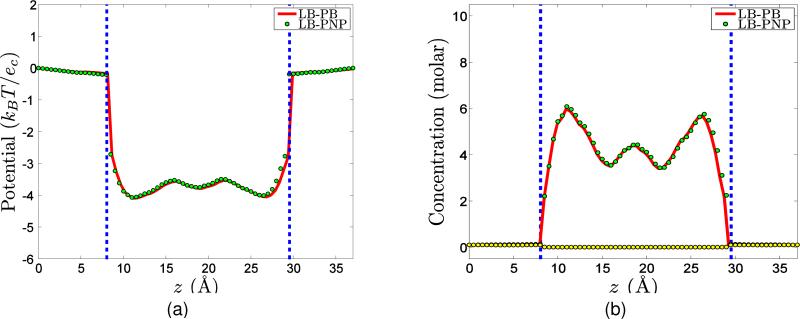
Figure 10.
Comparison of cross sections of electrostatic potential and concentration profiles with Φ0 = 0mV and ρ0 = 0.1molar for Gramicidin A channel. The concentrations of cations and anions are labeled with green and yellow dots, respectively. Two vertical dashed lines indicate the channel region.. (a) Electrostatic potential profiles; (b) Concentration profiles.

