
Figure 4.
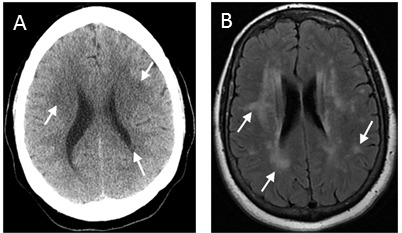
Leukoaraiosis on CT versus MRI. Leukoaraiosis in the same patient on CT (A), seen as multifocal patchy hypodensities in the periventricular and subcortical white matter (arrows), and MR (B), much more clearly demonstrated as foci and patches of hyperintensity on T2 FLAIRimage (arrows). The differences in the shape of the skull and lateral ventricles are due to the difference in scan angle; the CT gantry is tilted to reduce radiation dose to the orbit.