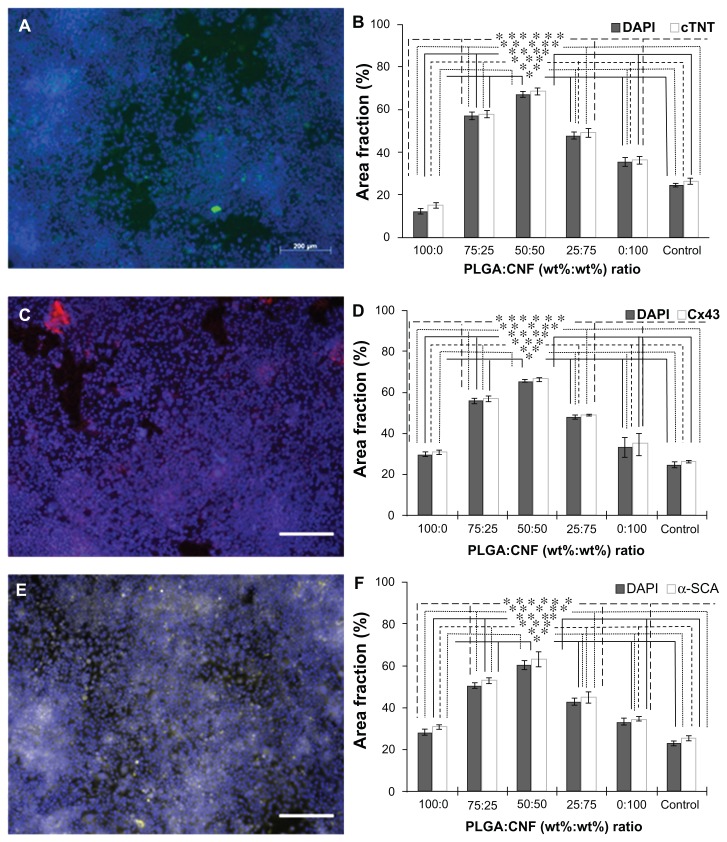
Figure 8.
Immunofluorescence staining for cardiomyocyte biomarkers on a 0.025 g/mL PLGA density PLGA:CNF composite after 120 hours of incubation. (A) Cardiac troponin T (green) biomarker with DAPI stain (blue) on a 50:50 (PLGA:CNF [wt%:wt%]) sample. (B) Connexin-43 (red) with DAPI stain (blue) on a 50:50 (PLGA:CNF [wt%:wt%]) sample. (C) α-SCA (yellow) with DAPI stain (blue) on a 50:50 (PLGA:CNF [wt%:wt%]) sample within the cardiomyocytes, indicating cardiomyocyte activity on the materials. Seeding density was 5.5 × 10⁴ cells/mL. Scale bar 200 μm. Area fraction (%), area of stain on the surface compared with the total area of image, of DAPI (nucleus) and (B) cardiac troponin T, (D) connexin-43, and (F) α-SCA after 120 hours of cell incubation, on all PLGA:CNF (wt%:wt%) ratio samples.
Notes: The results indicate trends similar to those of the adhesion and proliferation experiments (Figure 6), thus verifying those results and indicating cardiomyocyte activity on the materials. Seeding density was 5.5 × 10⁴ cells/mL. Data are shown as the mean count of n = 3. Control was glass substrate. *P < 0.05 versus 100:0 (PLGA:CNF [wt%:wt%]) ratio sample; **P < 0.05 versus 75:25 (PLGA:CNF [wt%:wt%]) ratio sample; ***P < 0.05 versus 50:50 (PLGA:CNF [wt%:wt%]) ratio sample; ****P < 0.05 versus 25:75 (PLGA:CNF [wt%:wt%]) ratio sample; *****P < 0.05 versus 0:100 (PLGA:CNF [wt%:wt%]) ratio sample, and ******P < 0.05 versus control sample.
Abbreviations: CNF, carbon nanofibers; cTNT, cardiac Troponin-T; PLGA, poly(lactic-co-glycolic-acid).

