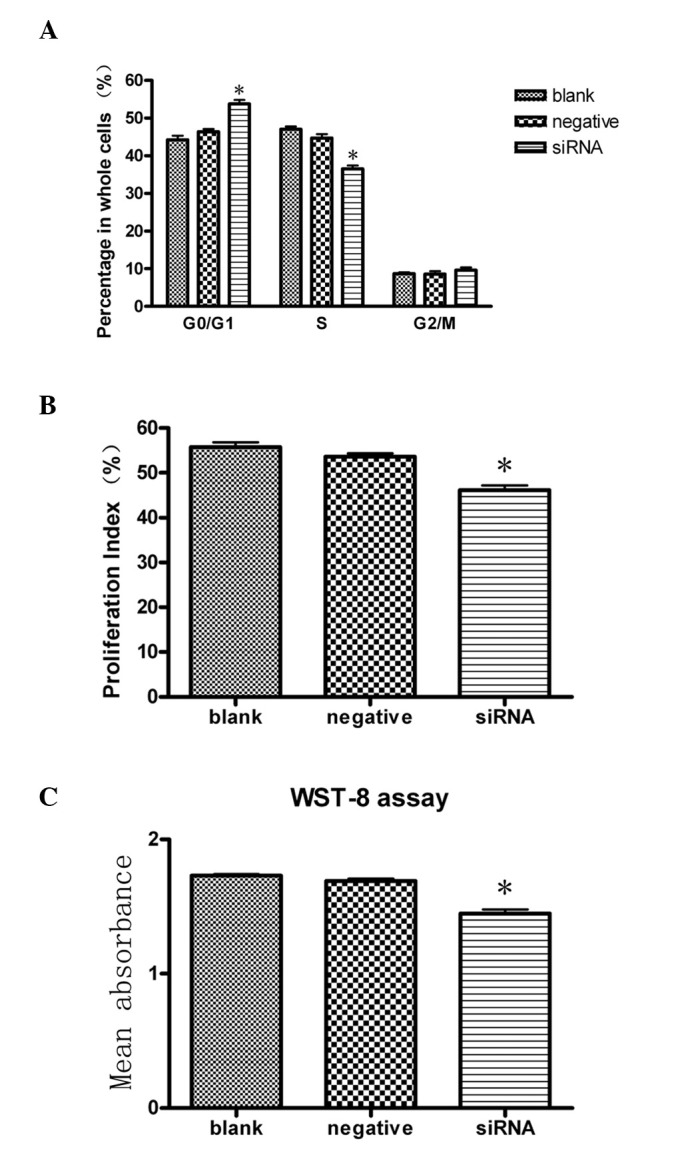
Figure 2.

Knockdown of JMJD2A resulted in cell cycle change and proliferation inhibition. (A) Column diagram analysis of the percentages of cells at each phase of the cell cycle in three different cell groups: G0/G1 phase, S phase and G2/M phase. At G0/G1 phase, there was a significant difference in the percentage of cells in the siRNA group compared with the blank and negative control groups. At S phase, there was a significant difference in the percentage of cells in the siRNA group compared with the blank and negative control groups, whereas no significant differences were observed in the percentages of cells at G2/M phase in the three groups. (B) Column diagram analysis for the proliferation indices (PI) calculated in the three different cell groups. PI in the siRNA group was significantly lower than that in the blank and negative control groups. (C) Column diagram analysis for the mean absorbance of three different groups. The mean absorbance of the siRNA group was significantly lower than that of the blank and negative control groups. *P<0.05, compared with the blank and negative control groups.
