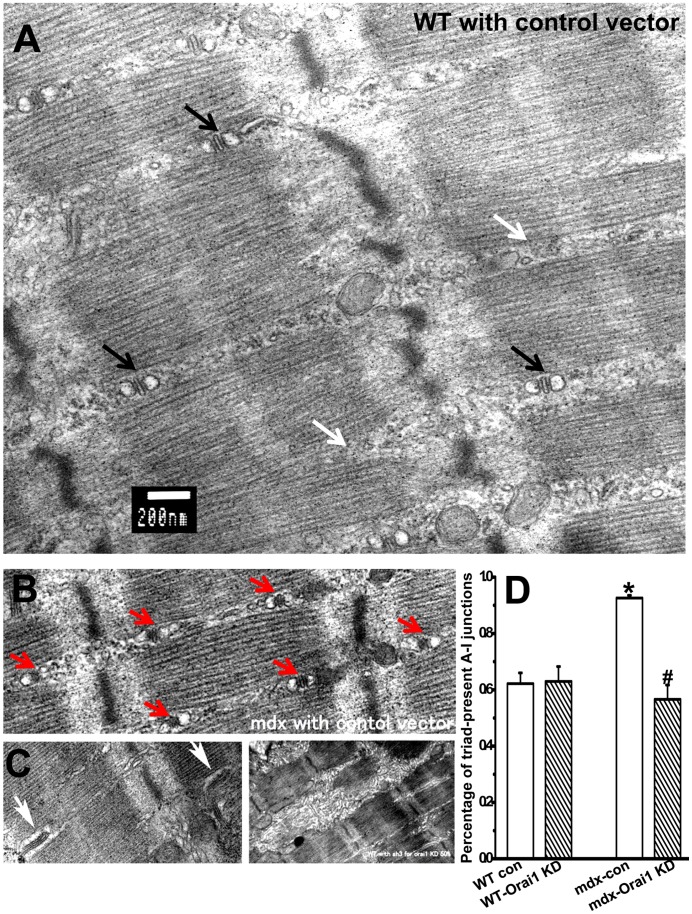
Figure 5. Changes in muscle ultrastructure after Orai1 knockdown.
Longitudinal section of FDB muscles under transmission EM of the (A) wt muscle transfected with control vector. Scale bar is 200 nm. Black arrows designate triads at A-I junctions and white arrows designate triad-defect A-I junctions; (B) mdx muscle transfected with control vector. Red arrows designate the dense triads at A-I junctions; (C) abnormal features observed in muscles with Orai1 knockdown. Left: disoriented triad junctional structure (white arrows); right: thick and rough reticulation as compared to the fine SR network structure in wt (A) and mdx control (B) muscle; (D) Statistical results summarize the percentage of triad-containing A-I junctions in muscle bundles from wt control, wt Orai1 knockdown, mdx control and mdx Orai1 knockdown. Data are mean ± S.E.M. *P<0.05 compared to wt control and # P<0.05 compared to mdx control.

