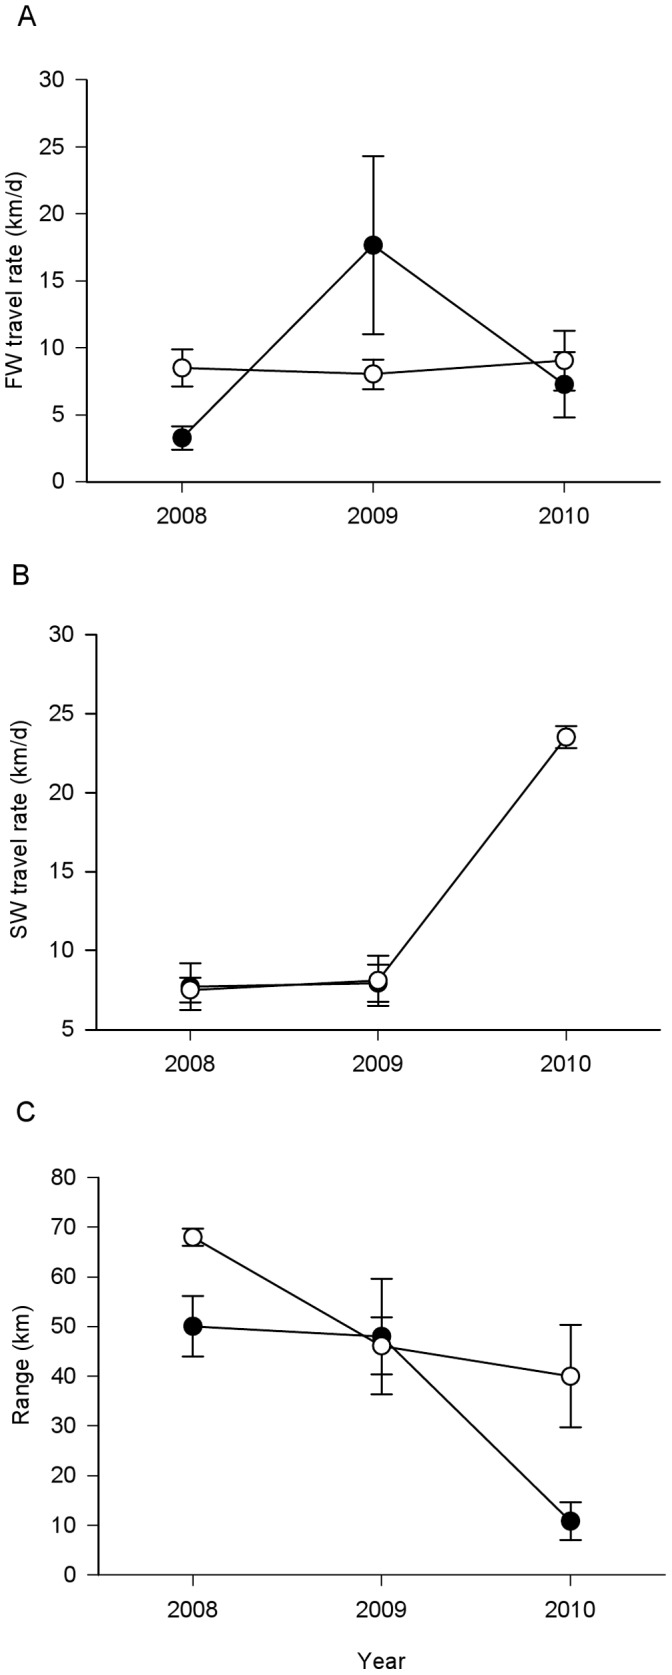
Figure 4. Migration behavior of wild and hatchery Skokomish smolts.

(A) Mean travel rate (±SE) from the point of release to the river mouth (13.5 km) for hatchery (black circles) and wild (open circles) individuals from the Skokomish River. (B) Mean travel rate (±SE) from the river mouth to the Hood Canal Bridge (75 km) for hatchery (black circles) and wild (open circles) individuals from the Skokomish River. (C) Mean migration range (distance between the Skokomish River estuary and the northernmost detection point) (±SE) for hatchery (black circles) and wild (open circles) individuals from the Skokomish River. Black circles are partially obscured by the white circles.
