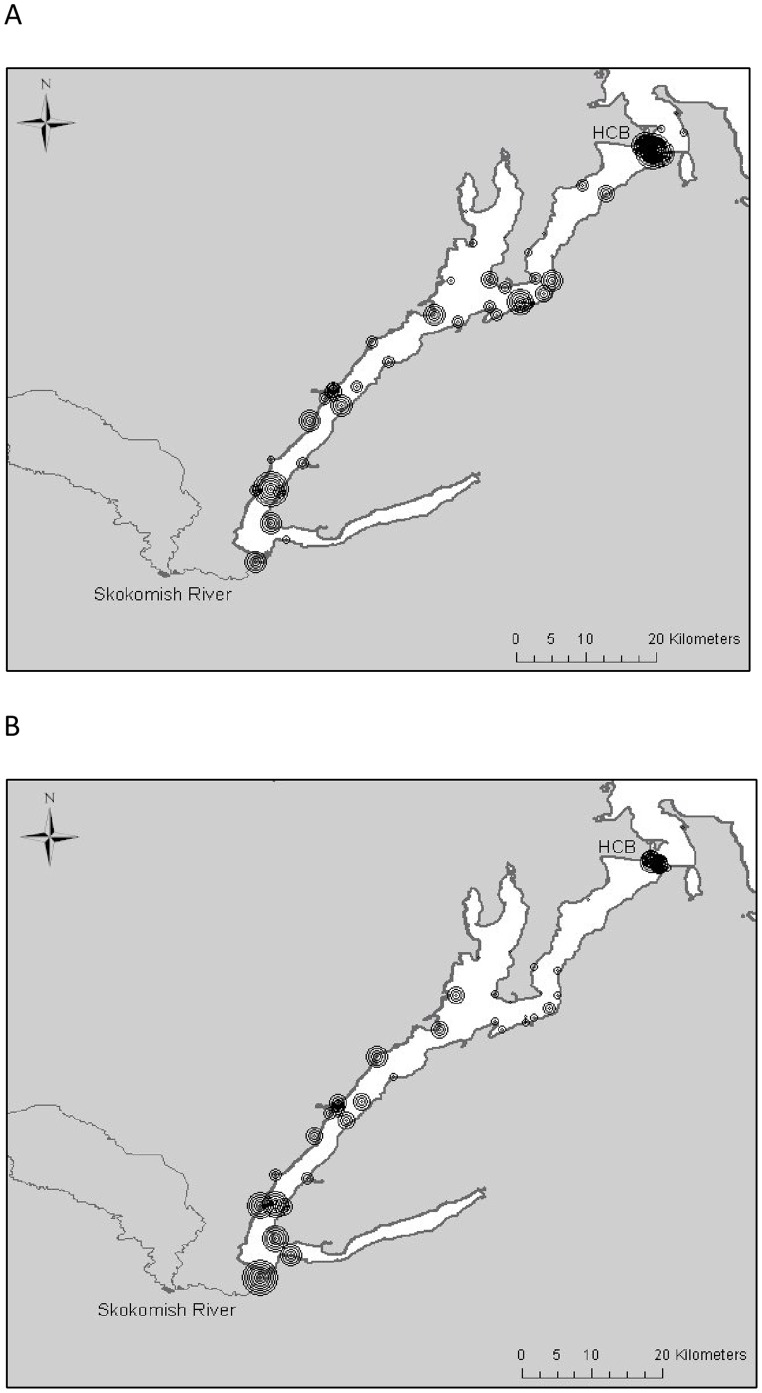
Figure 5. Density plots of wild and hatchery Skokomish smolt migration in 2008.
Concentric circles represent the relative number of smolts detected at each acoustic receiver. Larger circles represent a greater proportion of the total number of fish detected in the Hood Canal (8 concentric circles = 50%) than smaller circles, which represent a small proportion (1 circle = 10%) of the fish in the sample. Plot (A) depicts 2008 Skokomish wild smolt detection densities, and plot (B) shows 2008 Skokomish hatchery smolt detection densities.

