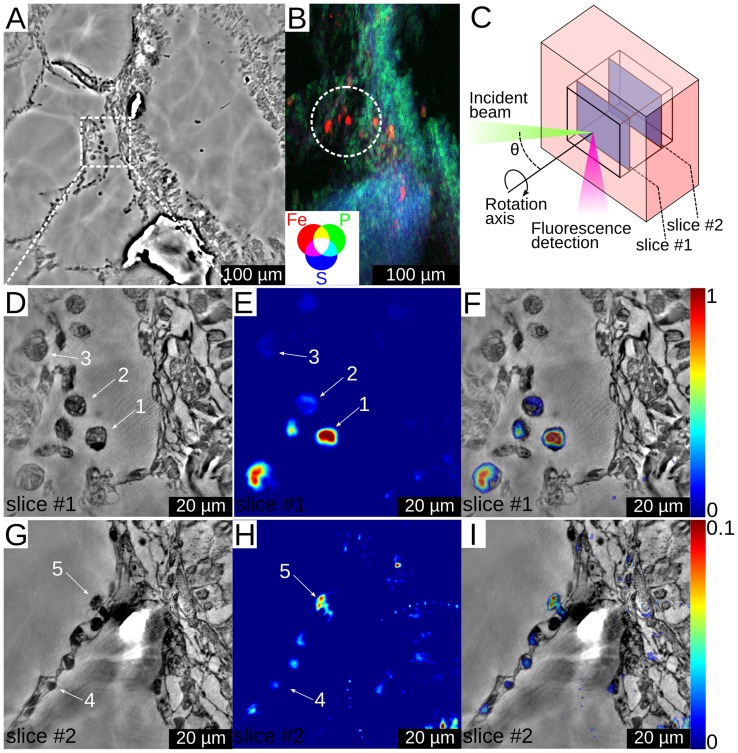
Figure 3. Imaging of carbon nanotube contamination in lung tissue.
(A) Slice from a low resolution electron density volume. (B) Low resolution 2D fluorescence image of the specimen showing iron, phosphorus and sulfur distributions. The circle indicates the ROI that was chosen for higher resolution imaging. The scanned area was about 0.2×0.3 mm2 and the step size was 1.8 µm. (C) A schematic representation of the imaging geometry, showing the ROI inside the sample and the two slices that were chosen for further analysis. Phase contrast slice with 60 nm pixel size (D), Fe fluorescence slice with 500 nm pixel size (E) and correlative image of Fe and phase contrast (F) for slice #1 in the lung specimen. Numbers 1, 2, and 3 indicate positions of alveolar macrophages. Phase contrast (G), Fe fluorescence signal (H) and correlative image of Fe and phase contrast (I) for slice #2 in the lung specimen. Number 4 indicates the position of a type 1 pneumocyte, while number 5 indicates the position of an alveolar macrophage. Notice the factor of 10 difference in the relative fluorescence signal between parts (E, F) and (H, I).

