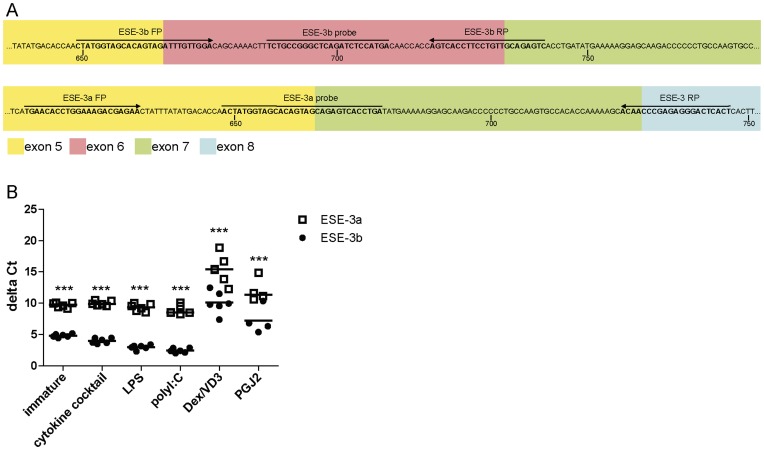
Figure 4. ESE-3b is the main ESE-3 isoform in moDC.
Monocytes were negatively selected from PBMC using magnetic beads. Immature moDC were generated with IL-4 and GM-CSF for 6 days. 15d-PGJ2 (PGJ2 DC) and dexamethasone plus 1α,25-dihydroxyvitamin were added to generate tolerogenic moDC, respectively (PGJ2 DC and Dex/VD3 DC). To generate immunogenic moDC, immature moDC were stimulated for 24 h with LPS, polyI:C and a cytokine cocktail containing TNF-α, IL-1β, IL-6 and PGE2, respectively. ESE-3a and ESE-3b mRNA levels were determined by quantitative RT-PCR analyses. (A) Primers and probes used for quantitative real-time RT PCR are marked. Exons are color-coded as in Figure 1. Positions of the base pairs of the open reading frames are indicated by numbers. (B) Relative amounts of ESE-3a and ESE-3b cDNA in various moDC populations. Transcript levels of GAPDH were used to calculate delta Ct values. Lower delta Ct values indicate higher amounts of target mRNA. N = 4–6. Significant differences between delta Ct values of ESE-3a and ESE-3b within the same moDC population are indicated. ***p<0.001.

