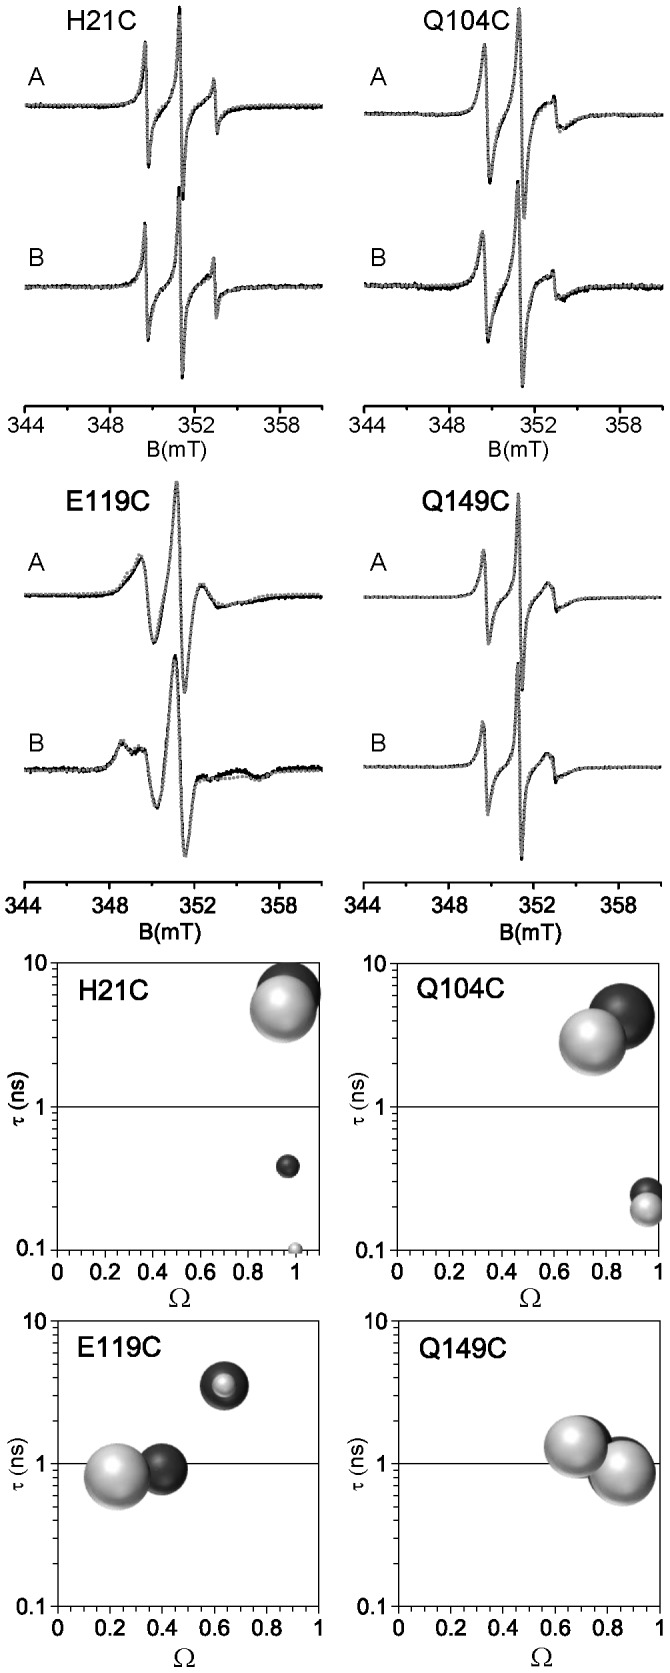
Figure 2. Dynamic studies of the different labeled sites of NarJT.

Upper panel: Room temperature EPR spectra of the different labeled NarJT variants in the absence (A) and presence of 10-fold molar excess of the NarG(1–15) peptide (B) in 50 mM Tris-HCl pH 7.9, 100 mM NaCl buffer. Simulated spectra (dotted grey line) are superimposed on the experimental spectra (solid black line). Simulation of the spectra was conducted as described previously [44]. Lower panel: simulated parameters given as [τ-Ω] plots, with τ the effective rotational correlation time in ns and Ω the normalized free rotational space, in the absence (dark gray spheres) and presence (light gray spheres) of the peptide. The area of the spheres is proportional to the relative contribution of the EPR spectral shape components.
