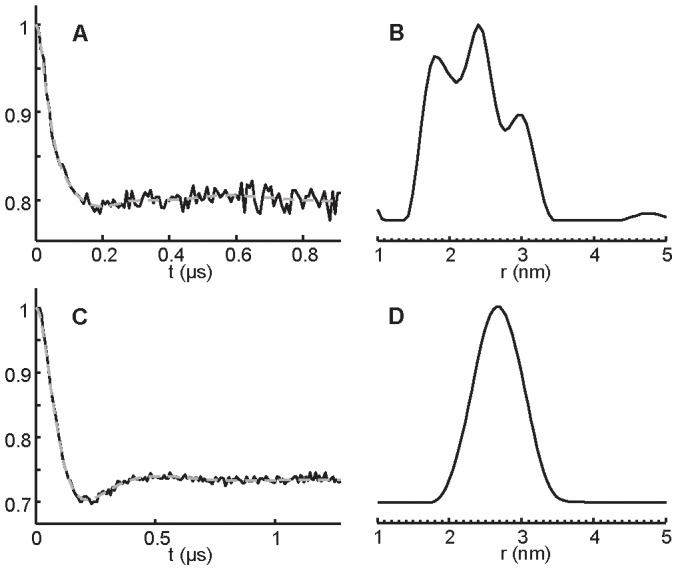
Figure 3. Distance distribution from X-band DEER experiments.

(A) and (C): Background corrected DEER time traces (solid line) from a four-pulse DEER experiment on the bi-labeled NarJT (H21C/Q104C) in the absence (A) and presence of 10-fold molar excess of the NarG(1–15) peptide (C) in 50 mM Tris-HCl pH 7.9, 100 mM NaCl buffer. Fits are shown as superimposed gray dotted lines. (B) and (D): Inter-label distance distributions calculated from the DEER time traces by using Tikhonov regularization (DeerAnalysis2011 software package [48]) in the absence (B) and presence of the peptide (D).
