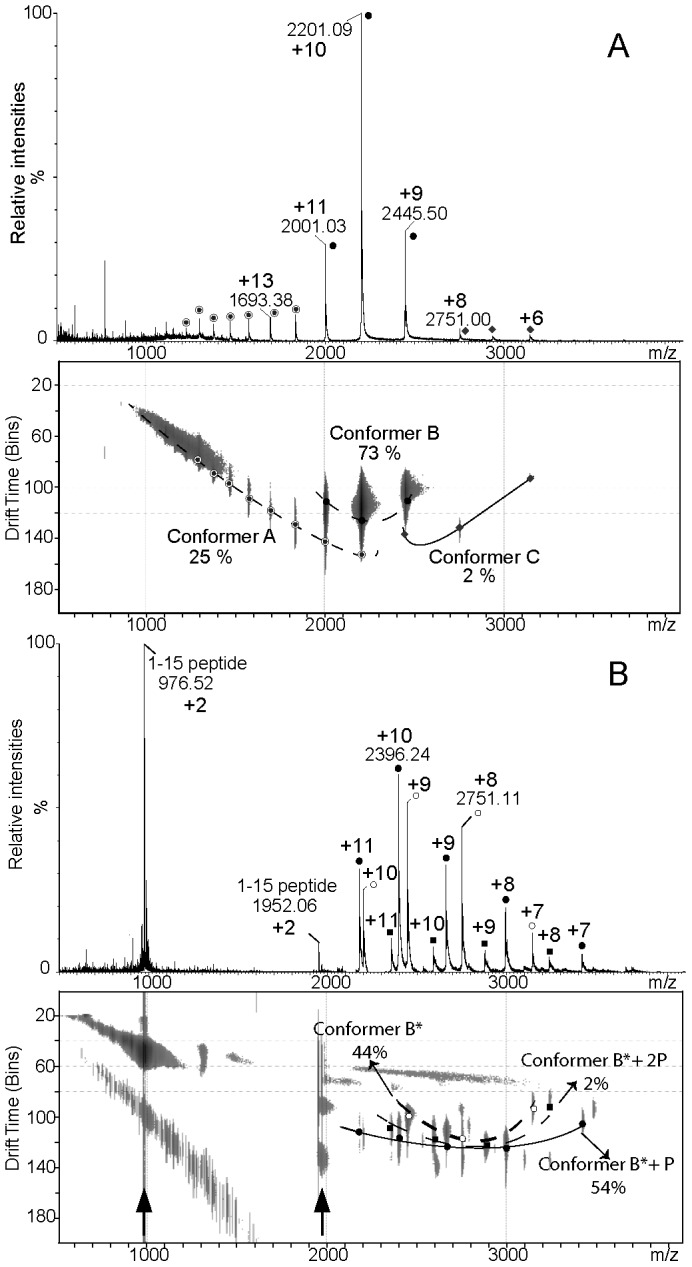
Figure 5. Mass spectra and drift charts recorded under non denaturing conditions of (A) NarJT and (B) NarJT in the presence of the NarG(1–15) peptide.

Each panel (A and B) is composed of the ESI-MS spectra (top) and the corresponding drift chart represented in drift time versus m/z (bottom) obtained by Ion Mobility. Ratios intensities according to the TIC of each spectrum are given in drift charts. Curves depicted in black correspond to drift time curves identified for each NarJT conformers. In panel A, respective charge states of NarJT conformers (Conformer A = filled circle circled, Conformer B = filled circles, Conformer C = diamond) are labeled both on mass spectrum and mobility chart. In panel B, open circles correspond to NarJT alone (conformer B*); filled circles correspond to NarJT complexed with its partner peptide (conformer B*P); filled squares correspond to NarJT complexed with 2 molecules of its partner peptide (conformer B*2P). Arrows in panel B denote +1 and +2 CS of NarG(1–15) peptide observed all along the TWIM cell. A drift time value of 1 bin corresponds to 90 µs.
