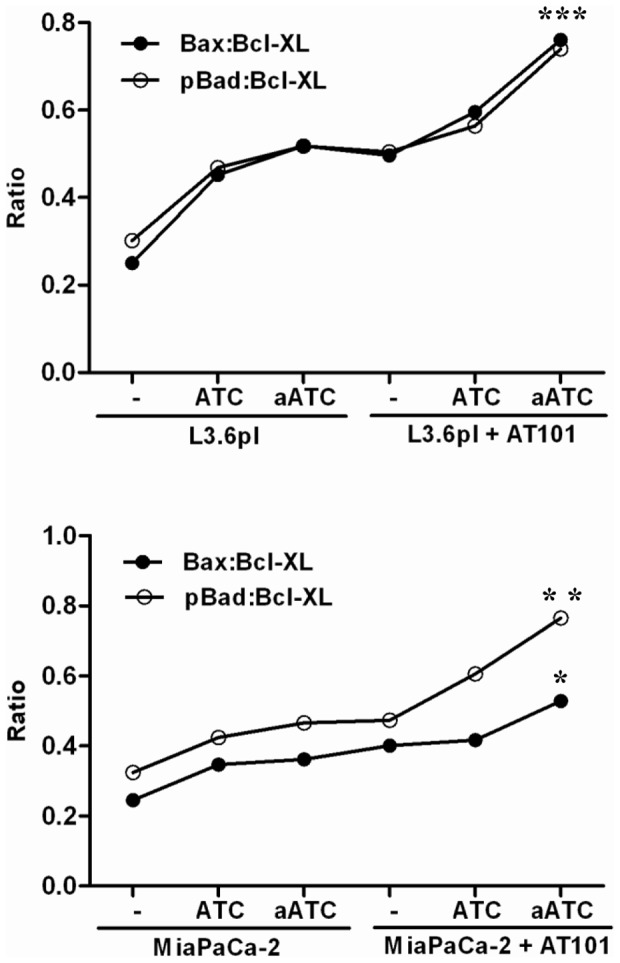
Figure 13. Shows the ratio of p-Bad: Bcl-XL and Bax: Bcl-XL under the indicated experimental conditions.

Ratio of p-Bad: Bcl-XL and Bax: Bcl-XL showed a significant difference between AT-101 treated and untreated L3.6pl and MiaPaCa-2 cells in the presence of aATC. Representative data from two experiments with the same results are shown.
