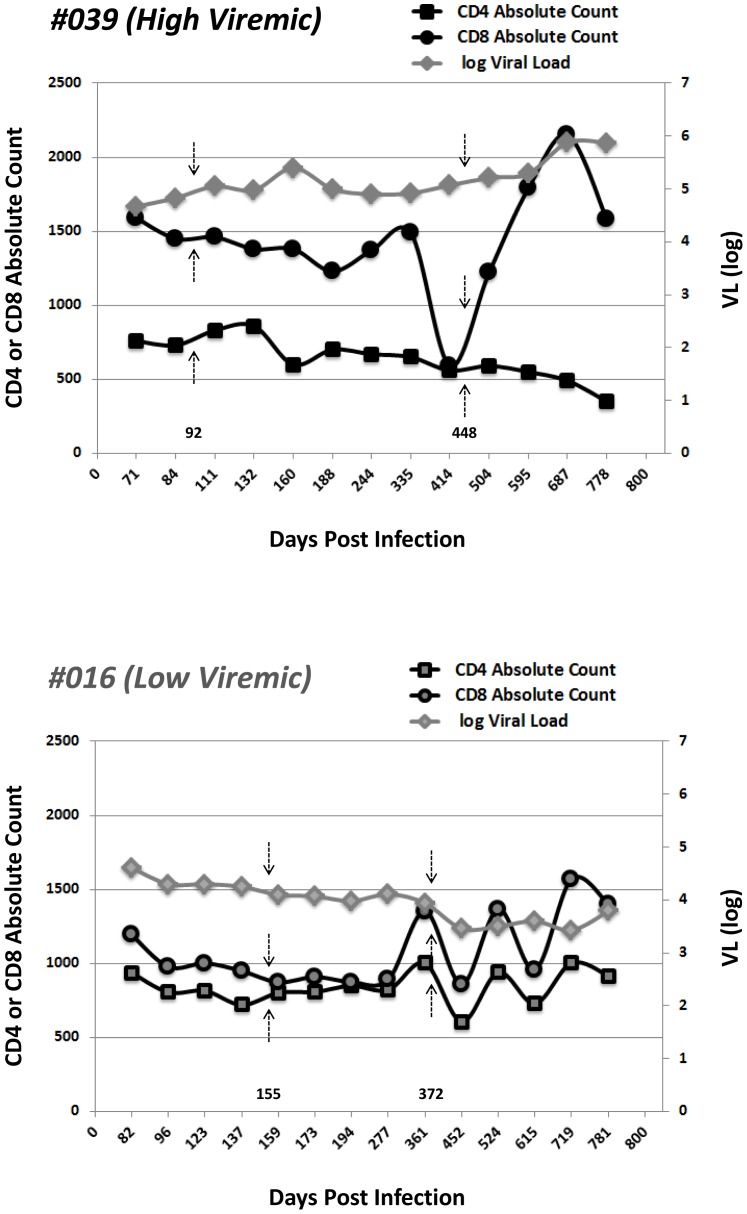
Figure 1. Viral load, CD4+ and CD8+ T-cell counts (n = 2).
Viral load (triangles; 46731 and 41023 viral RNA copy/ml of plasma), absolute CD4+ T-cell count (squares) and absolute CD8+ T-cell count (circles) are shown for two time points. The grey arrows show the time points in which the virus was sequences and the black arrows indicate the time points in which the leukapheresis blood was taken and PBMCs were used in this study.

