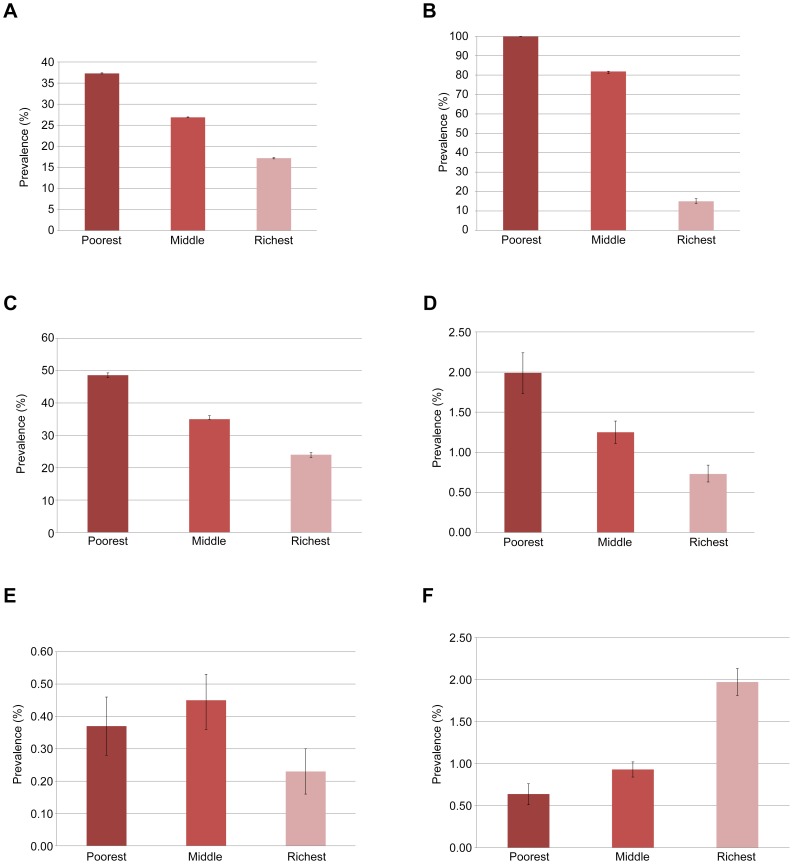
Figure 2. Prevalence of Key TB Risk factors (and 95% Confidence Interval) by wealth level*.
Figure 2a. Tobacco Use (Cigarettes, chewing tobacco or other). Figure 2b. Exposure to Indoor Air Pollution. Figure 2c. Low BMI (less than 18.5 kg/m2). Figure 2d. Alcohol Use (daily). Figure 2e. HIV seroprevalence. Figure 2f. Diabetes Mellitus. FOOTNOTE TO FIGURES 2a–f: * Wealth level or socio economic status is divided as follows: poorest 40%, middle 40%, and richest 20%.

