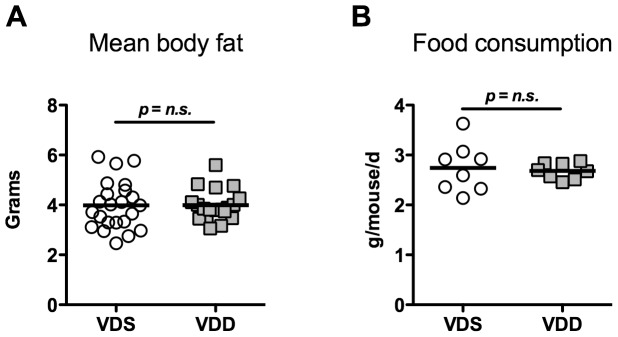
Figure 1. Body composition and food intake.
(A) Mean body fat in vitamin D sufficient (VDS, n = 23) and vitamin D deficient (VDD, n = 19) mice of both genders as determined by quantitative magnetic resonance. (B) Food consumption by VDS and VDD mice averaged over two weeks as determined by measuring food weight loss per cage divided by number of mice per cage and the number of days between measurements. n = 8 cages/genotype.

