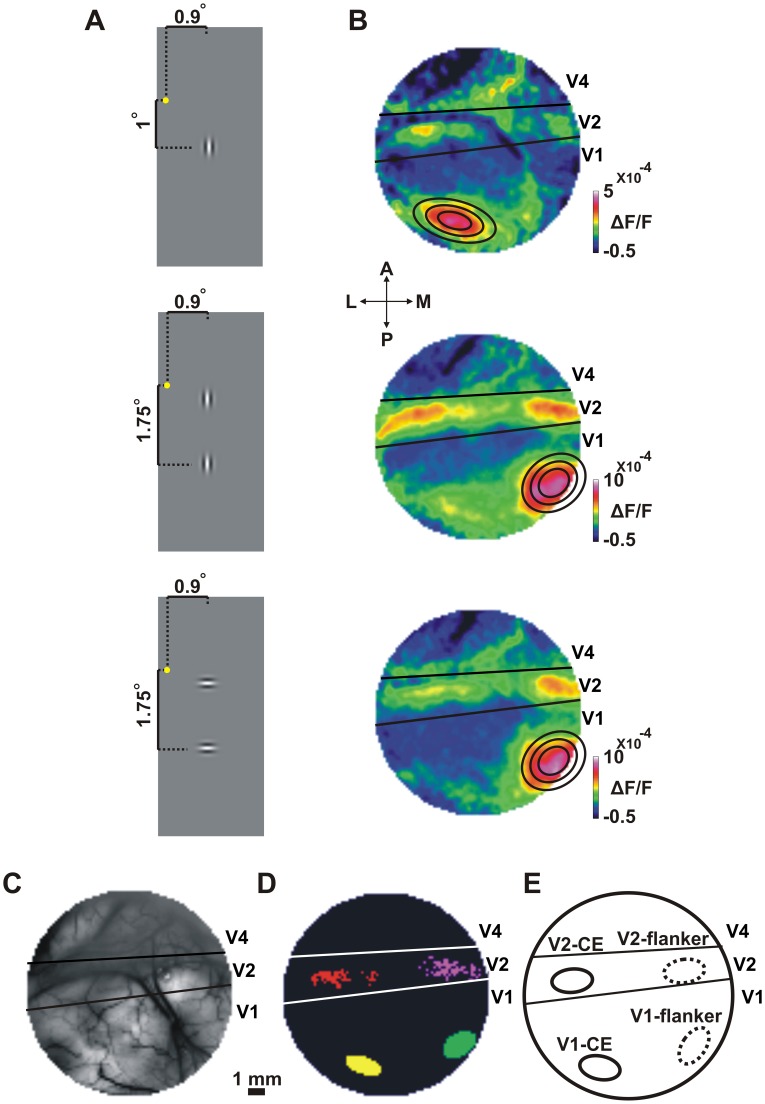
Figure 1. Retinotopic mapping of the central element and the flanker.
A: Schematic illustration of the Gabor stimuli used for retinotopic mapping: the central element (CE, top) and the two flankers, vertically (middle) or horizontally (bottom) oriented were presented in separate trials. Fixation point is marked with a yellow dot. B: Average population response (VSDI amplitude) maps evoked by the stimuli in A. Maps and stimuli in A are presented in a corresponding order (from top to bottom). Color denotes fluorescence change (ΔF/F). The maps show activation patches in V1 for the central element (V1-CE activated area) and the lower flanker (V1-flanker activated area; the upper, more foveal flanker evoked neuronal activation outside the imaged area). In V1, a 2D Gaussian fit of the neuronal activation at the V1-CE activated area (top) and V1-flanker activated area (middle and bottom) are superimposed on the corresponding maps. Inner to outer contours represent the top 10%, 20% and 40% outlines of the Gaussian, respectively. Pixels within the top 10% fitted Gaussian area were defined as the ROIs in V1. In V2 we defined V2-CE and V2-flanker ROIs as pixels exceeding an SNR threshold. C: Blood vessel pattern of the imaged area. Black lines mark the border between V1/V2 and the lunate sulcus (LUS) located between V2 and V4. D: The four ROIs taken for analysis in this specific recording session: V1-CE (yellow), V1-flanker (green) and V2-CE (red) and V2-flanker (purple). E: A schematic illustration of the four ROIs in D in a more general outline. The schematic illustrations in E and D will be used throughout the following Figs.

