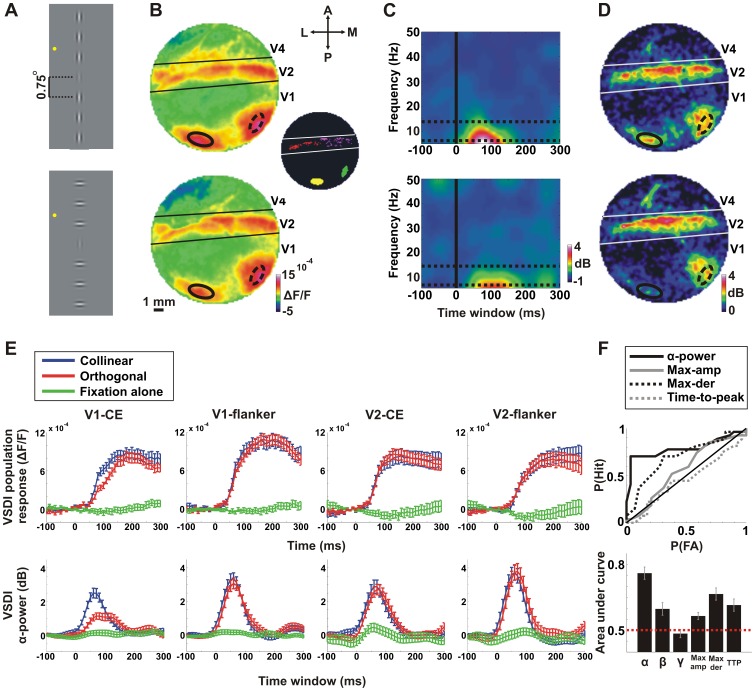
Figure 2. Spectrograms and α-power analysis of the VSDI signal.
Data are from a representative recording session except for F, lower panel. A: Schematic illustration of the visual stimuli conditions: collinear (top) and orthogonal (bottom) conditions in which a central Gabor element (CE) was displayed at 16% contrast and the flanker Gabors were displayed at 64% contrast. The distance between Gabors was set at 0.75° (3λ). Fixation point is marked with a yellow dot. B: Population response (VSDI amplitude) maps evoked by the stimuli in A. Maps and stimuli in A are presented in a corresponding order (from top to bottom). The maps were averaged at 100–200 ms after stimulus onset. Color denotes normalized fluorescence change (ΔF/F). The ROIs of the V1-CE and V1-flanker are superimposed on the maps (solid and dashed black lines, respectively). The inset shows the 4 analyzed ROIs: V1-CE (yellow), V1-flanker (green) and V2-CE (red), V2-flanker (purple). C: VSDI spectrogram for the collinear (top) and orthogonal (bottom) conditions averaged over pixels in V1-CE. Color denotes power in dB. Time 0 is stimulus onset. Frequency range is 6–50 Hz (see Materials and Methods). The α-band is confined between two horizontal dashed lines. D: Average α-power maps (averaged 0–100 ms time window) for the collinear (top) and orthogonal (bottom) conditions. Color denotes α-power in dB. The spatial patterns of the α-power are corresponding to the population response maps depicted in B. E: Top row: VSDI population response for the collinear (blue), orthogonal (red) and fixation alone (green) conditions for the 4 ROIs (from left to right): V1-CE, V1-flanker, V2-CE and V2-flanker. Error bars indicate mean±SEM over trials (n = 27, 29 and 28 trials for the collinear, orthogonal and fixation alone conditions respectively). Bottom row: The same as the top row but for the VSDI α-power. F: A receiver-operating characteristic (ROC) analysis on collinear vs. orthogonal single trials for different neural population measures: average α-power (0–100 ms); average β-power (0–100 ms), average γ-power (0–100 ms), maximal population response, maximal derivative of the population response and time-to-peak of the population response. Top panel: the ROC curves of most population measures for a typical recording session. Bottom panel: the AUC for each neuronal population measure was calculated in each recording session separately and then averaged across all recording sessions. Error bars indicate mean±SEM over recording sessions (n = 8 recording sessions).

