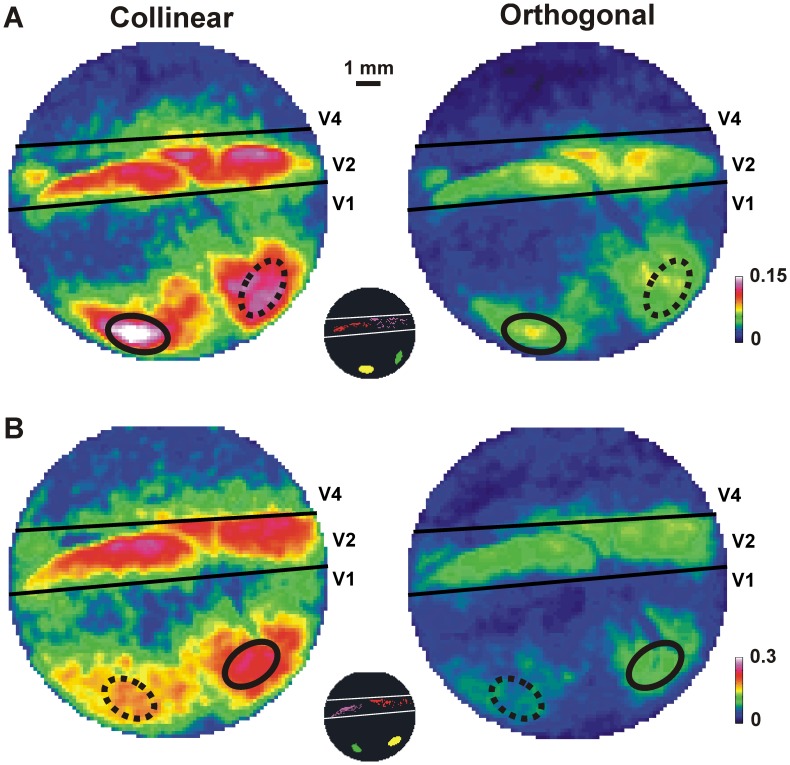
Figure 3. α-coherence maps in collinear and orthogonal conditions.
A: Average α-coherence (AAC; averaged over 0–100 ms after stimulus onset) maps in the collinear (left) and orthogonal (right) conditions in one recording session. Each pixel in the map reflects the average AAC of that pixel with the ROI of V1-CE in the collinear (left) and orthogonal (right) conditions. Color denotes coherence values. The ROI of V1-CE (solid black ellipse) and the ROI of V1-flanker (dashed black ellipse) are superimposed on all maps. Inset indicates the 4 ROIs: V1-CE (yellow), V1-flanker (green), V2-CE (red) and V2-flanker (purple) for this recording session. B: AAC maps as in A, but for a different recording session with changed positions of CE and flanker.

