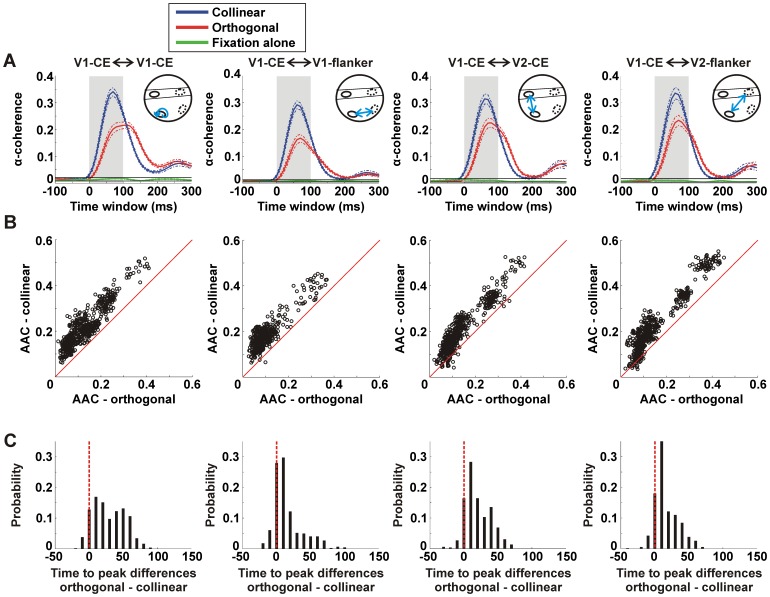
Figure 4. α-coherence dynamics in collinear and orthogonal conditions.
A: α-coherence as a function of time between V1-CE and other ROIs for the collinear (blue), orthogonal (red) and fixation alone (green) conditions averaged over pixels within each of the 4 ROIs (from left to right): V1-CE (n = 555 pixels), V1-flanker (n = 444 pixels), V2-CE (n = 523 pixels) and V2-Flanker (n = 545 pixels). Dashed lines indicate mean±3×SEM. Black horizontal lines indicate upper and lower limits of the α-coherence (mean±3×SEM) in the fixation alone condition. A change in α-coherence is defined by exceeding these limits. There was significantly higher stimulus-induced α-coherence in both collinear and orthogonal conditions compared to the fixation alone condition (Mann-Whitney U-test; p<0.01; averaged 0–100 ms). The inset depicts the pair of ROIs (blue arrow) from which α-coherence was calculated (see Fig. 1E). B: Scatter plots of the average α-coherence (AAC) averaged 0–100 ms after stimulus onset (shaded bar in A) in the collinear (y-axis) vs. the orthogonal (x-axis) conditions for each pixel in the different ROIs as in A. Each point reflects the average α-coherence of all pixel pairs between this specific pixel (in a specific ROI) and the V1-CE ROI pixels (equation 8). Almost all pixels are above the diagonal meaning there is higher AAC in the collinear than the orthogonal condition. C: Histograms of time-to-peak (TTP) differences (orthogonal - collinear) of the α-coherence for the all pixels in the four ROIs as in B. Time = 0 indicates that peak α-coherence was reached at the same time window in both conditions. There is significantly lower TTP in the collinear than the orthogonal condition in each ROI (p<0.001). Data is from 8 recording session and 2 monkeys.

