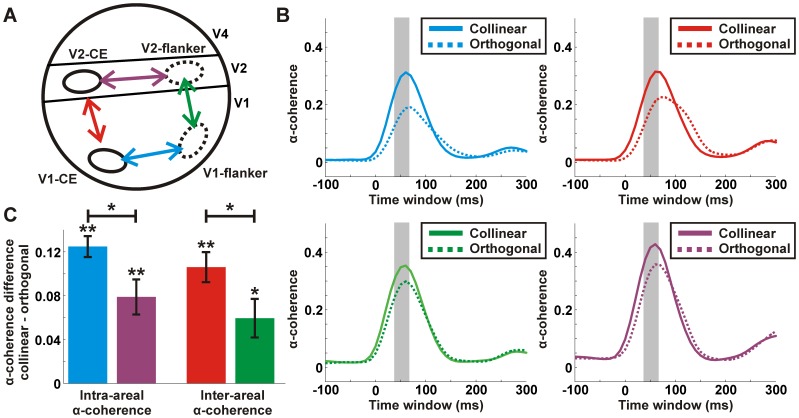
Figure 5. α-coherence between different ROIs in V1 and V2.
A: A schematic illustration of the 4 ROIs used in this study: V1-CE, V1-flanker, V2-CE and V2-flanker. Superimposed are 4 different interactions each representing a pair of ROIs: V1-CE and V1-flanker (blue), V1-CE and V2-CE (red), V1-flanker and V2-flanker (green), V2-CE and V2-flanker (purple). B: The α-coherence as a function of time for the collinear (solid lines) and orthogonal (dashed lines) conditions calculated between each of the four pairs in A. C: α-coherence difference (collinear – orthogonal) between each of the four pairs in A. α-coherence was average 40–60 ms after stimulus onset (shaded bar in B). Error bars indicate SEM over recording sessions (n = 8 recording session from 2 monkeys). Asterisks denote significant α-coherence compared to 0 or between pairs. * p<0.05; ** p<0.01.

