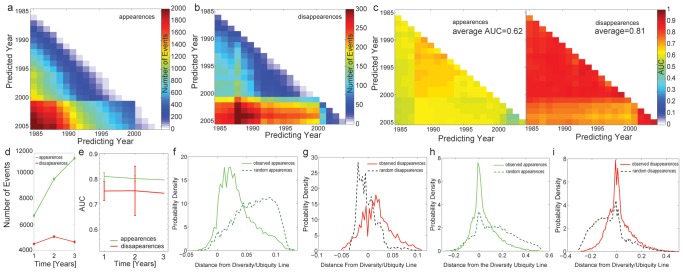
Figure 3. Predicting appearances and disappearances using nestedness.
a Number of appearances for every pair of years in the country-product network. b Number of disappearances for every pair of years for the country-product network. c Accuracy of the predictions for each pair of years measured using the Area Under the ROC Curve (AUC). d Average number of appearances and disappearances for the Chilean data (error bar smaller than symbol). e Average accuracy of the predictions for the municipality-industry network. Error bars indicate 99% confidence intervals. f Distribution for the distance to the diversity-ubiquity line obtained for the observed appearances and for an equal number of random appearances. g Same as f but for disappearances. h Same as f, but for the municipality-industry network. i Same as h but for disappearances.

