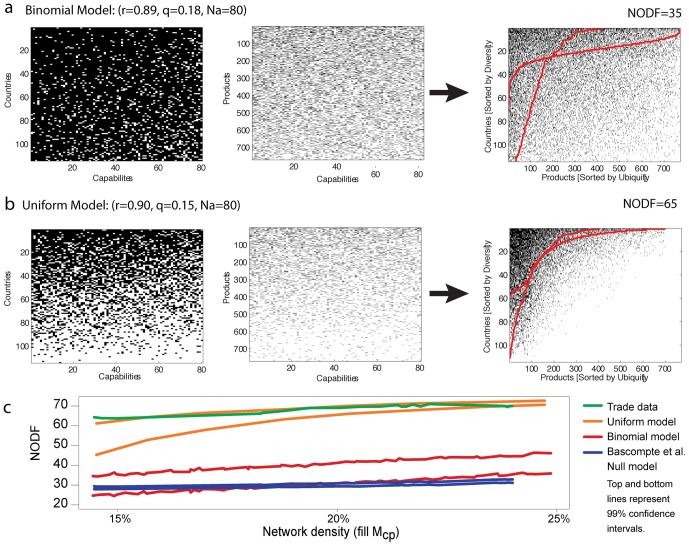
Figure 4. Modeling nestedness.
a Illustration of the binomial model. From left to right; Cca, Ppa and the resulting Mcp. b Illustration of the uniform model. From left to right Cca, Ppa and the resulting Mcp. c NODF as a function of matrix fill for the country-product network (green), the uniform model (orange), the binomial model (red), and the Bascompte et al null model (blue).

