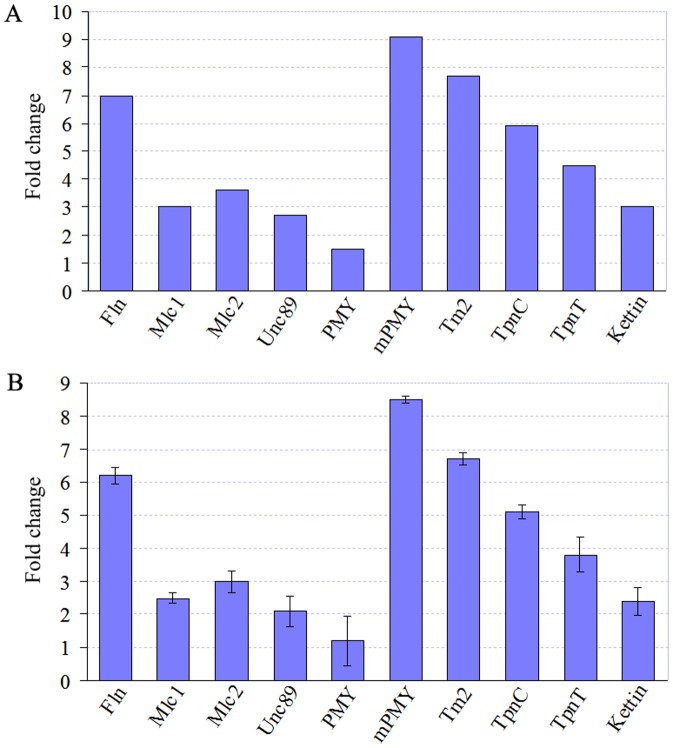
Figure 9. Genes in flight muscles from adult RLF.
A: Gene expression analysis from DGE data. The fold changes in gene expression were calculated as the log2 ratio of adults (TPM) to 3rd instar larvae (TPM). B: qRT-PCR analysis of gene expression. This figure shows the fold change of differential expression for 10 genes (Fln, Mlc1, Mlc2, Unc89, PMY, mPMY, Tm2, TpnC, TpnT, Tm1, and Kettin) in adults compared with 3rd instar larvae.

