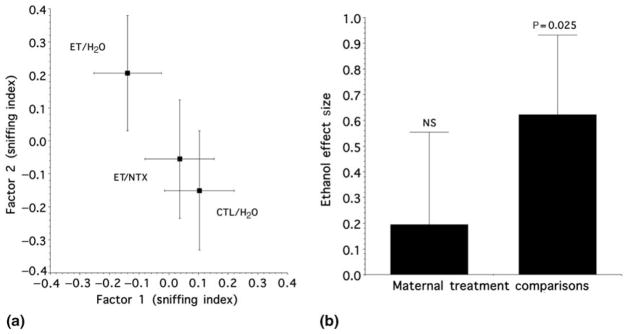
Figure 1.
(a) Relative position of the maternal treatment groups in an odor-mediated behavioral response space. For any two groups, the degree to which their responses were similar maps as the degree of closeness in the space. The data are expressed as the mean (± 2D SEM) composite sniffing indexes for the maternal treatment groups. (b) ‘Ethanol Effect Size’ (mean ± SEM from the weighted effect size analysis) as a function of maternal treatment comparison. The left column quantifies the degree of difference between ET/NTX versus CTL/H2O in (a). The right column quantifies the magnitude of the effect of our standard fetal ethanol exposure paradigm (i.e. ET/H2O) relative to the average effects (in two dimensions) of the ET/NTX and CTL/H2O exposures. ET/H2O, ethanol-containing diet and control injection; ET/NTX, ethanol-containing diet and naltrexone injection; CTL/H2O, free-choice control liquid diet and control injection; NS, not significant

