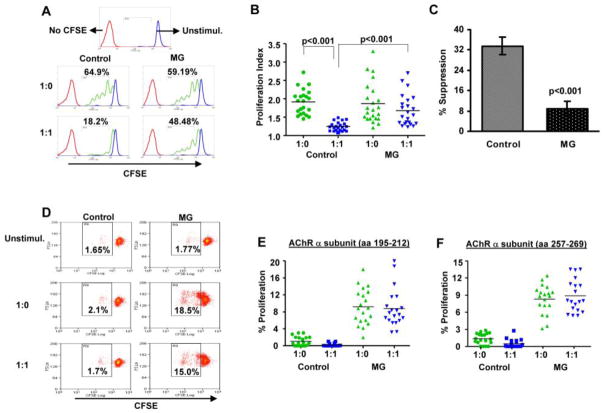
Figure 2.
MG Tregs fail to suppress polyclonal and antigen-specific T cell proliferation. CFSE-labeled Tresp cells were co-cultured with/without equal numbers of sorted CD4+CD25highCD127low/− cells, and stimulated with anti-CD3 antibodies or AChR-α peptides in the presence of irradiated APCs as described in Materials and methods. (A) Representative flow cytometry plots illustrate CFSE dilution profiles of anti-CD3 driven T cell proliferation in single healthy control and MG patient. Dot plot depiction of proliferation index (B) in T lymphocyte cultures (1:0 indicates Tresp cells cultured alone; 1:1 indicates Tresp/Treg co-cultured at 1:1 ratio), and percentage of Treg suppression (C) for MG patients (n =23) and healthy controls (n =22). (D) Flow cytometry dot plots illustrating CFSE dilution profiles for AChR-α subunit peptide [aa 195-212] stimulated T cell proliferation in a single healthy control and MG patient. (E) and (F) Percent proliferation in T lymphocyte cultures for stimulation with (E) AChR-α peptide [aa 195-212] (n = 20 MG patients and 20 healthy controls); and (F) AChR-α peptide [aa 257-269] (n = 19 MG patients and 19 controls) are shown.

