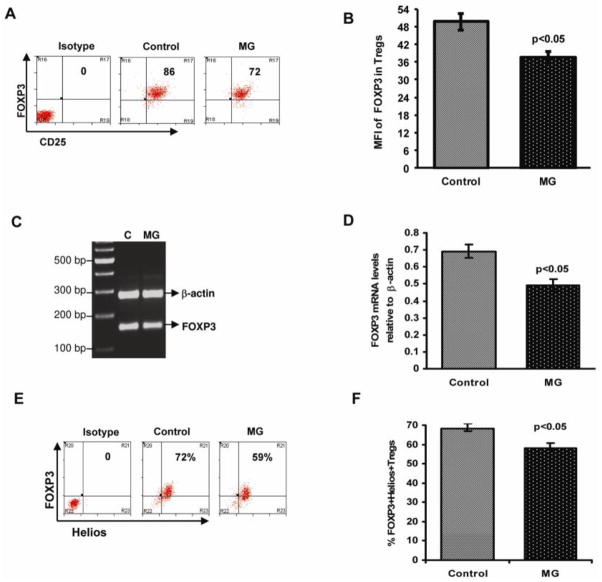
Figure 3.
Attenuated FOXP3 expression in Treg cells from MG patients. Sorted CD4+CD25highCD127low/− Tregs were fixed and permeabilized, stained with anti-Foxp3/Helios and analyzed by flow cytometry. (A) Representative flow cytometry dot plot depicts the intensity of intracellular FOXP3 protein expression in Treg cells from an MG patient and an age-matched healthy control. (B) The bar diagram shows intensity of intracellular FOXP3 protein expression in Tregs in MG patients (n =24) and controls (n = 24). FOXP3 mRNA expression was determined by Multiplex PCR. Total RNA, extracted from sorted CD4+CD25highCD127low/− Treg cells from normal healthy controls (n=5) and MG patients (n=5), was reverse transcribed and a 158bp fragment corresponding to FOXP3 was amplified and separated on a 2% agarose gel. Gels were densitometrically scanned and cDNAs were normalized to that of β-actin, which was coamplified along with the cDNA of interest. (C) Representative gel from MG patient and control. (D) Bar diagram showing relative FOXP3 mRNA expression in isolated Tregs from MG patients compared to healthy controls. (E) Representative flow cytometry dot plot depicts Helios and FOXP3 protein co-expression in Treg cells from an MG patient and an age-matched healthy control. (F) Bar diagram showing intensity co-expression of Helios and FOXP3 protein in Tregs in MG patients (n =14) and controls (n = 14).

