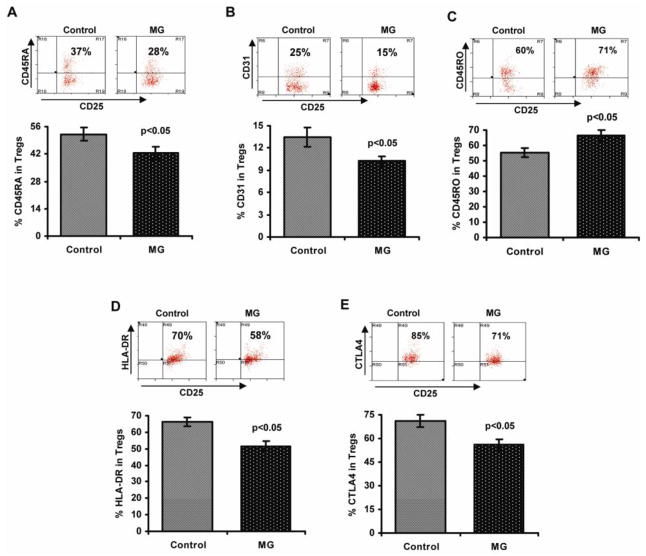
Figure 5.
Phenotypic characterization of CD4+CD25highCD127low/− Tregs in MG patients vs healthy controls. Cell staining was performed as described in “Materials and methods.” Representative flow cytometry plots and bar diagrams showing the percentage of CD45RA+ (A), CD31+ (B), CD45RO+ (C) Treg cell subsets; percentage of cells expressing HLA-DR (D) and CTLA-4 (E) in Tregs isolated from MG patients (n=14) and control subjects (n=14).

