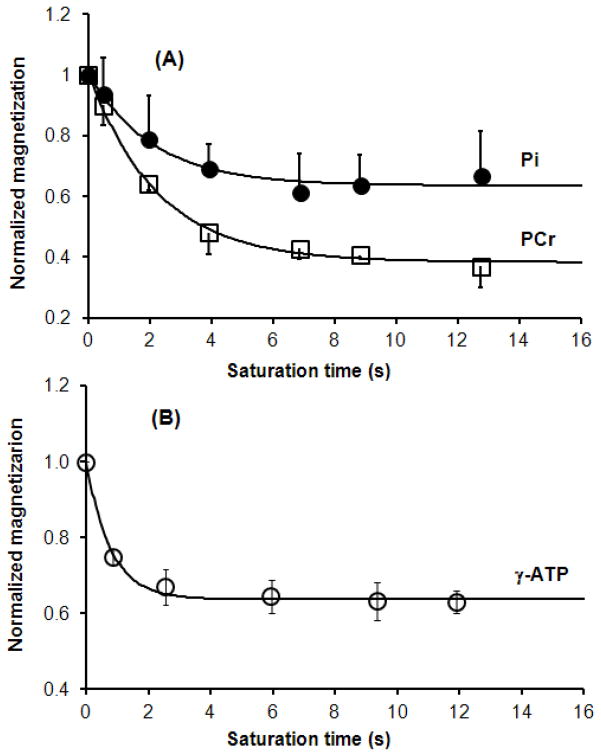
Fig. 5.
Dependence of the averaged normalized resonance peaks integrals on the saturation time for one-site saturation (A, n=9) and two-site saturation (B, n=8), respectively. The peak integrals represent the normalized Ms/M0 ratios with the correction of offset RF saturation effect. The apparent and intrinsic spin-lattice relaxation times of PCr and Pi, the forward rate constants ( and ), were determined by the regression analyses presented in (A). The apparent and intrinsic spin-lattice relaxation times of γ-ATP, the reverse rate constant ( ), were determined by the least-square regression and presented in (B).

