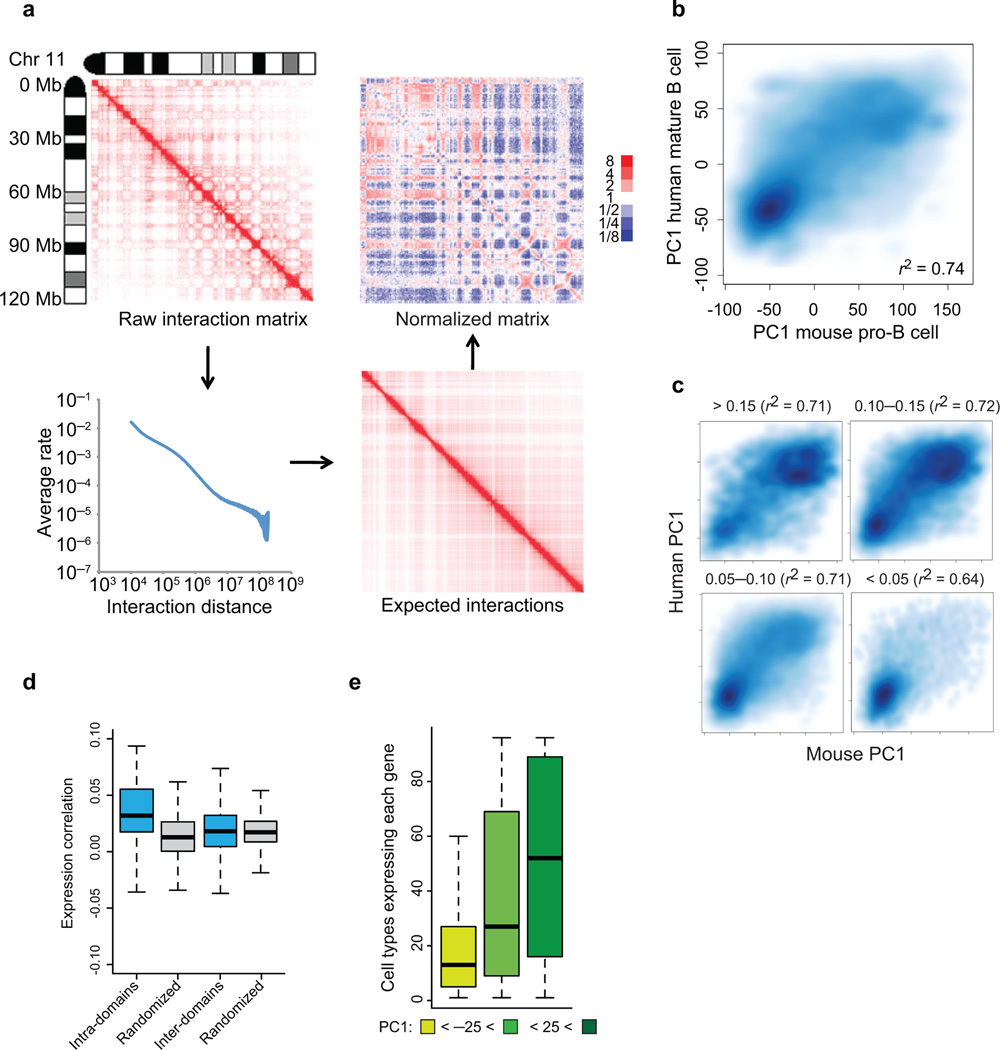
Figure 1.
The folding pattern of the pro-B cell genome. (a) Strategy for Hi-C data normalization from expected interaction frequencies. Normalized genome-wide contact matrix revealing intrachromosomal interactions involving chromosome 11. Indicated are the ratios of observed versus expected reads. Blue pixels represent lower than expected whereas red pixels reflect higher than expected interaction frequencies. (b) Conservation of PC1 values of murine pro-B cells versus syntenic regions derived from human mature-B lineage cells. Scatter plot of a genome-wide comparison of PC1 values using 50 kb windows derived from mouse chromosome 11 of pro-B cells and syntenic regions derived from human mature-B lineage cells. Intensities of blue pixels correspond to density of indicated regions. (c) Regions with high average PhastCons scores are more closely associated with transcriptionally permissive compartments to regions exhibiting low average PhastCons scores. (d) Coordinate patterns of gene expression and gene localization correlate well within chromatin domains but not with genes dispersed across domains. Distribution of average pair-wise correlations of gene expression values across 96 mouse tissues. Average pair-wise correlations were computed for each active domain for a minimum of ten genes. Values were calculated by comparing genes within the same domain (intra-domain) or by comparing genes in different domains (inter-domain) (P < 1 x10⁻⁷) (e) Genes located in the transcriptionally repressive compartment show a more lineage restricted pattern of gene expression as compared to loci positioned in a transcriptionally permissive compartment. For each annotated gene we calculated the number of tissues with detectable expression. The whisker-box plot shows the distribution of these values for genes located in the transcriptionally repressive compartment (PC1 < −25), genes located in regions that show intermediate PC1 values (−25 < PC1< 25), and genes located in the transcriptionally permissive compartment (PC1 > 25). Single Hi-C analyses were performed using either EGS or formaldehyde fixed cells. Gene expression was obtained from BIOGPS that were derived from two independent experiments (GSE10246).

