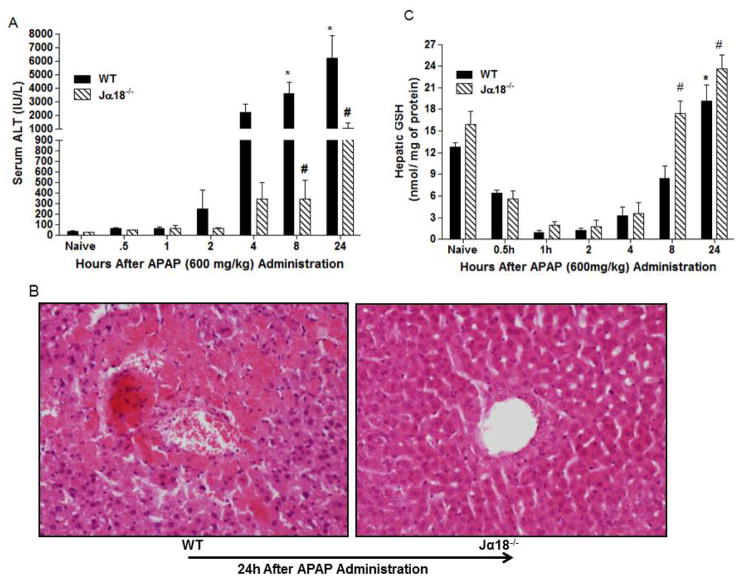
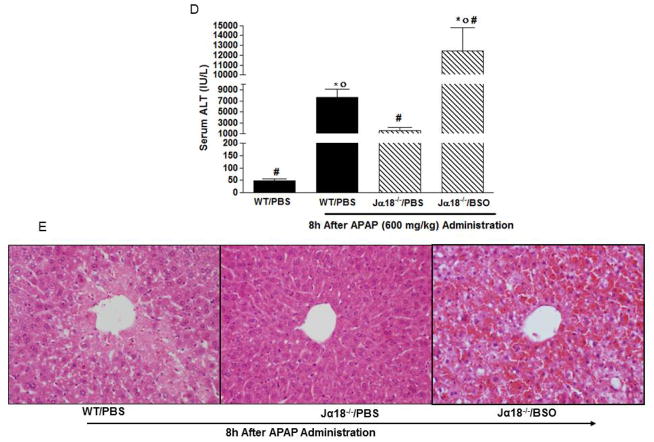
Fig. 1.
Time course for APAP hepatotoxicity in Jα18−/− mice and WT mice. (A) Serum ALT levels. (B) Representative H & E staining of liver sections from WT and Jα18−/− mice. (C) HPLC measurement of hepatic GSH levels in WT and Jα18−/− mice before and after APAP treatment. Data in (A) and (C) are presented as mean ± SEM with n=6–12 mice/group with *p<0.05 vs. naïve WT; #p<0.05 vs. corresponding WT as assessed by ANOVA/Newman-Keuls post hoc test. (D–E) Effect of GSH depletion on APAP liver toxicity in Jα18−/− mice. BSO or PBS was injected in WT and Jα18−/− mice (see methods) for assessment of serum ALT levels (D) and Histological injury by H & E staining of liver sections (E). Data in D is shown as mean ± SEM with n=7–19 mice/group with *p<0.05 vs. WT/PBS; #p<0.05 vs. WT/PBS/APAP; op<0.05 vs. Jα18−/−/PBS/APAP.


