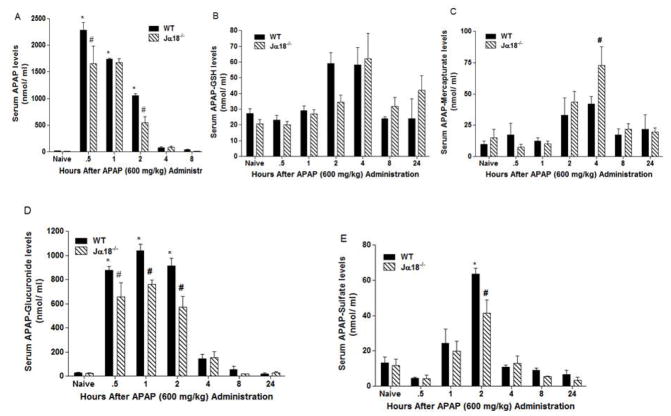
Fig. 3.
Evaluation of serum APAP and metabolites levels in WT and Jα18−/− mice by HPLC during APAP hepatotoxicity. (A) APAP; (B) APAP-GSH; (C) APAP-Mercapturate, (D) APAP-Glucuronide levels and (E) APAP-Sulfate levels. All data are presented as mean ± SEM with n=3–9 mice/group with *p<0.05 vs. naïve WT; #p<0.05 vs. corresponding WT.

