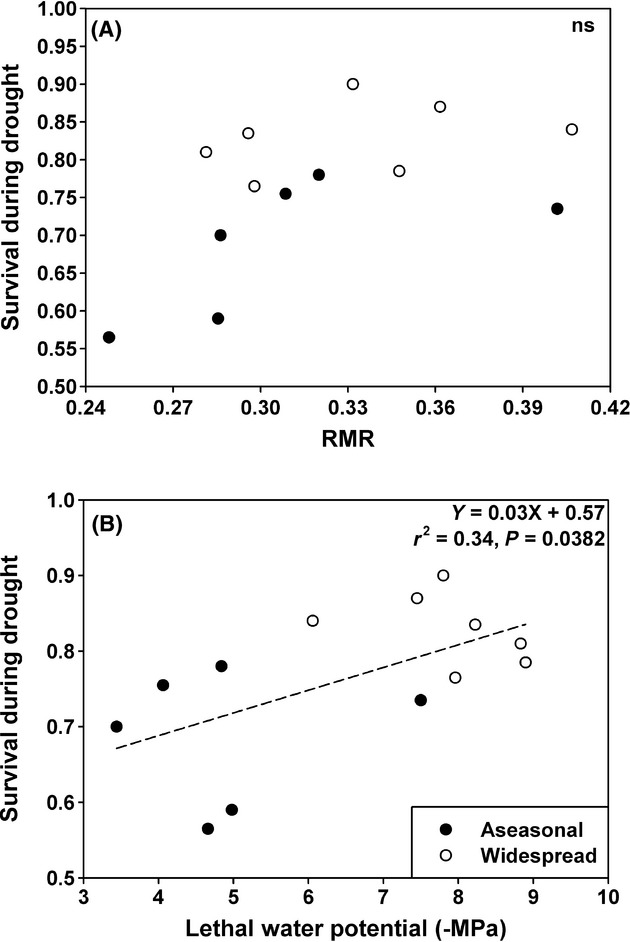
Figure 5.

Relationship between survival during drought and (A) root mass ratio (RMR) or (B) lethal water potential (i.e., tissue water potential prior to death; Baltzer et al. 2008). Values represent species' mean values. Statistics correspond with ordinary least squares regression analysis. Symbols are coded by distribution type, but regression lines were fit using the combined dataset. Definition of species distributions follows Fig. 2.
