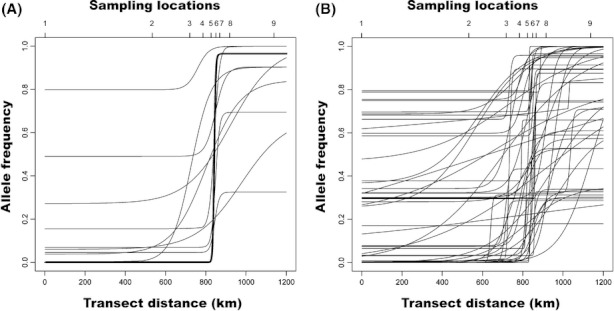
Figure 3.

Cline models fit to empirical data for all 61 clinal loci using Analyse 1.3. Panel A shows the mtDNA (bold) and nine isozyme loci, whereas panel B shows the 51 AFLP loci. Sampling locations are noted on the secondary X-axis starting with population 1 at 0 km transect distance.
