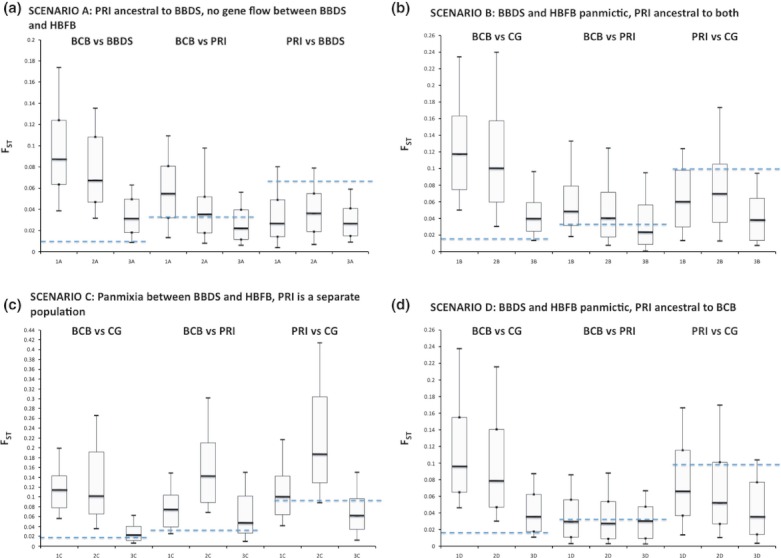
Figure 3.

Simulated and empirical pairwise ΦST values between putative populations for m = 0.1. Vertical lines show 95% highest posterior density (HPD) intervals for simulated ΦST values; top and bottom of box indicate 75% HPD intervals and thick horizontal lines show median values for simulations. Dotted horizontal lines show empirically observed pairwise ΦST values. CG = Canada-Greenland (BBDS and HBFB combined). (a) Scenario A; (b) Scenario B; (c) Scenario C; (d) Scenario D (see text for details).
