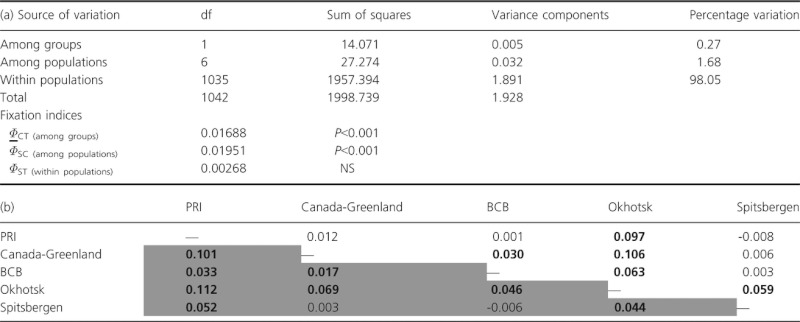
Table 2.
(a) Hierarchical AMOVA results, including variation between two groups of putative populations (Pacific and Atlantic), among putative populations, and within populations. (b) Pairwise genetic distances between sample sets: pairwise ΦST values are given below the diagonal and frequency-based FST values are given above. All bold values are significant after a False Discovery Rate correction
 |
