
Figure 4. AHI underestimation related to time spent in REM and supine position.
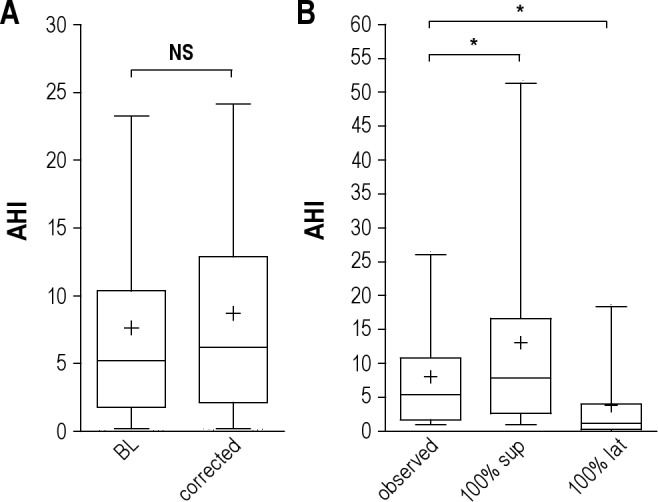
(A) Box and whiskers plots of the percent of the AHI (events/h) in our cohort in baseline conditions (“BL”) compared to that after adjustment for each individual who spent < 25% of TST in REM sleep (“corrected”). Median (central line), mean (+), 25–75th percentiles (box edges), and 5% to 95% range (whiskers) are shown. The groups are not different (Mann-Whitney rank test). (B) Box and whiskers plots of the AHI values related to body position. The baseline condition (“observed”) includes only those patients who spent 20% to 80% of the TST in the supine position. These values are compared to the supine AHI and the lateral AHI. *Significant difference by Kruskal-Wallis test with Dunn post-test.