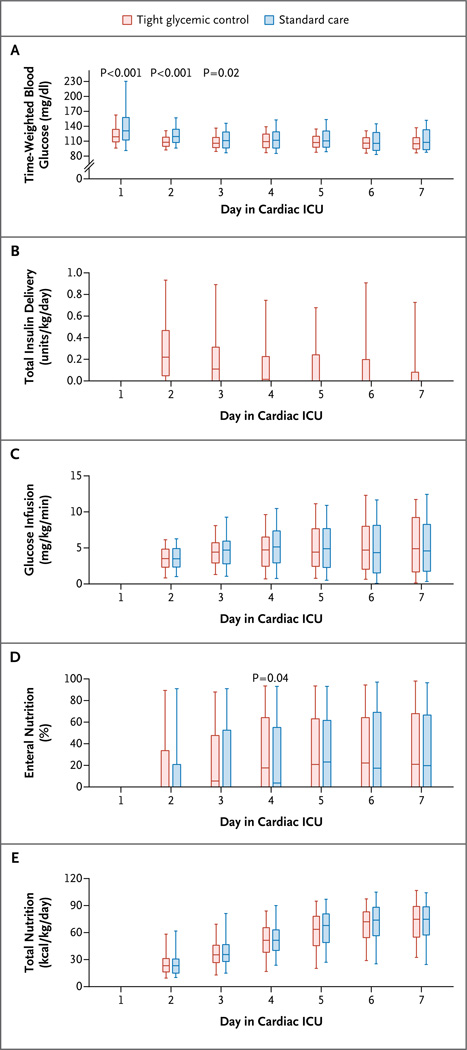
Figure 2. Glucose, Insulin, and Nutrition, According to Treatment Group.
Data in all the panels are for full 24-hour days during the period of critical illness. Panel A shows time-weighted blood glucose averages calculated from all blood glucose samples on the day of postoperative admission to the cardiac intensive care unit (ICU) (day 1) and the subsequent 6 days (7 a.m. to 6:59 a.m.). Panel B shows total daily insulin delivery. Panel C shows average daily glucose infusion rates. Panel D shows the daily percentage of nutrition delivered through the enteral route. Panel E shows total kilocalories of nutrition per kilogram of body weight per day. In each panel, the boxes represent the interquartile range (25th percentile to 75th percentile) and the horizontal lines the median; the whiskers extend to the 5th and 95th percentiles. To convert the values for glucose to millimoles per liter, multiply by 0.05551.

