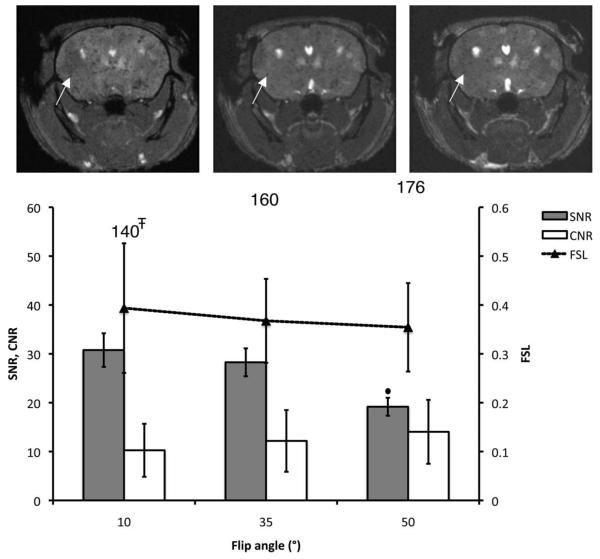
Figure 3.
Effect of the FA on void detection and tumor contrast. Brain SNR, CNR, and FSL are plotted for three different values of FA. The total number of detected voids is shown for each condition. The corresponding mouse brain 3D b-SSFP axial images acquired with FA = 10, 35, and 50° are shown from left to right. All of the images were acquired using BW = ±21 kHz and TR = 26 msec. The arrows point to a representative void, for which FSL remains the same with FA. ∓Significantly lower than values obtained with FA of 35° (P < 0.01). •Significantly lower than SNR measured at FA = 35° (P < 0.05).

