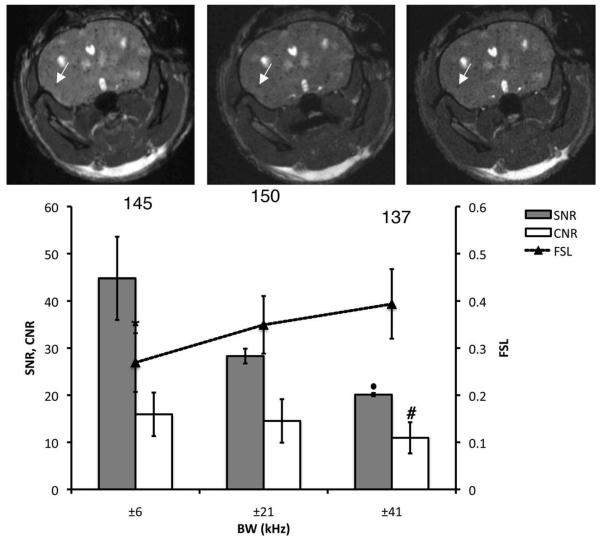
Figure 4.
Effect of the SNR on void detection and tumor contrast. Brain SNR, CNR, and FSL are plotted for three different values of rBW. The total number of detected voids is shown for each condition. In addition, the corresponding 3D b-SSFP axial images of the same mouse brain as in previous figures, acquired with rBW = ±6 kHz, ±21 kHz, and ±41 kHz, are shown from left to right. All of the images were acquired using FA = 35° and TR = 26 msec. increased The arrows point to a representative voids, which FSL with rBW. *Significantly lower FSL compared to rBW of ±21 or ±41 kHz (P < 0.05). #Significantly lower than CNR values at ±6 kHz (P < 0.01). •Significantly lower than SNR measured with rBW of ±6 or ±21 kHz (P < 0.05).

