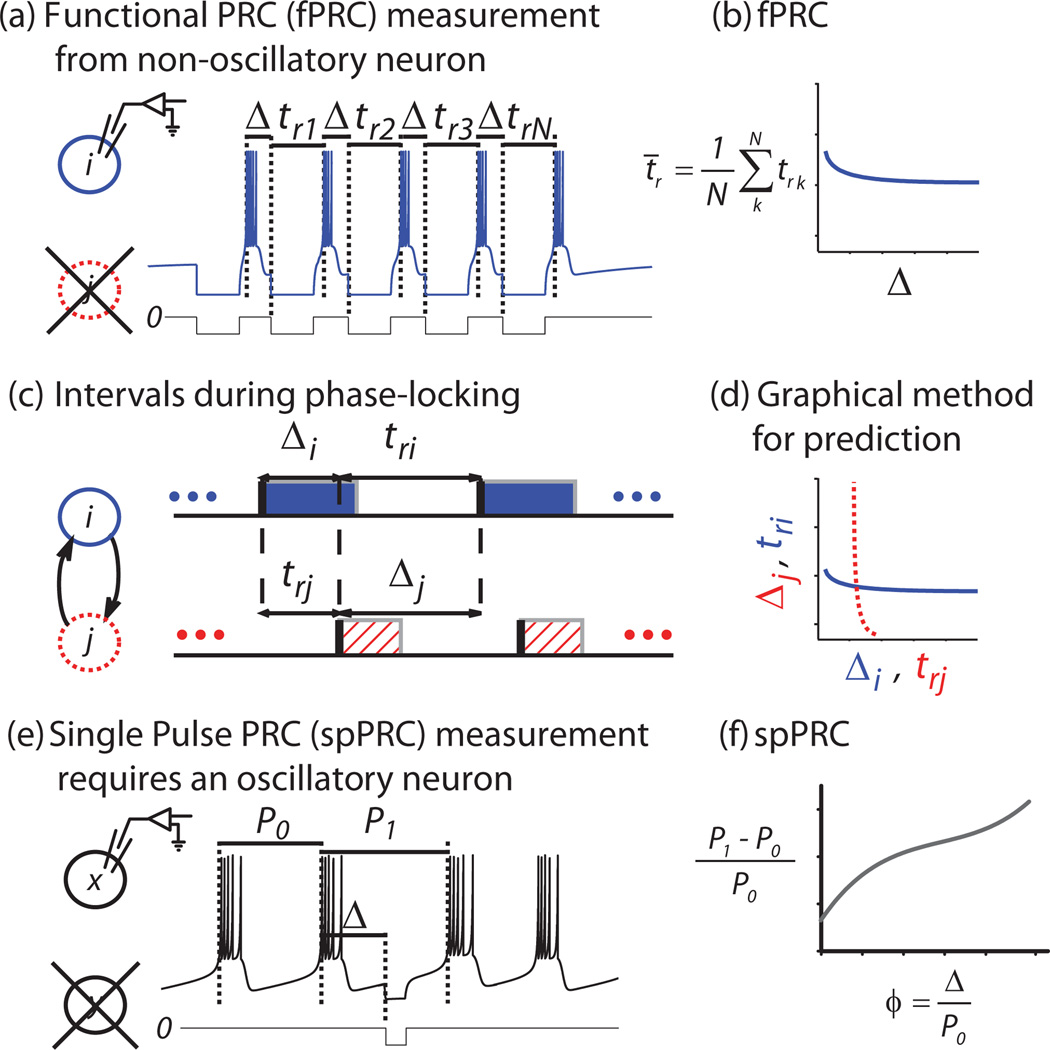
FIG. 1.
(Color online) Schematized protocols for PRC measurement in neurons. (a) Protocol for fPRC measurement: isolated nonoscillatory neuron i is silent at rest, but emits a burst in response to an initial input. An online protocol detects this burst and thereafter delivers a stimulus at fixed delay Δ after the initiation of each subsequent burst for N cycles. Response times trk are measured after each input. (b) The fPRC consists of averages t̄r tabulated across Δ. (c) Definition of terms: stimulus delay Δ and response time tr during 1:1 phase-locking are shown for bursting neurons i and j . The shaded and hatched regions correspond to the burst duration. (d) Graphical method for prediction: fPRCs for each component neuron are plotted on the appropriate axes such that any point of intersection gives a solution mode of 1:1 phase-locking. Stability is calculated as described in the text. (e) Protocol for spPRC measurement provided for comparison: phase shift to an ongoing oscillatory rhythm with period P0 is measured in isolated neuron x by delivering a single-pulse stimulus at delay Δ and measuring the resulting interval P1. (f) The spPRC consists of the relative change in period P1−P0 tabulated across delay Δ. Both terms are scaled to phase ϕ on [0,1) by normalizing by P0.

