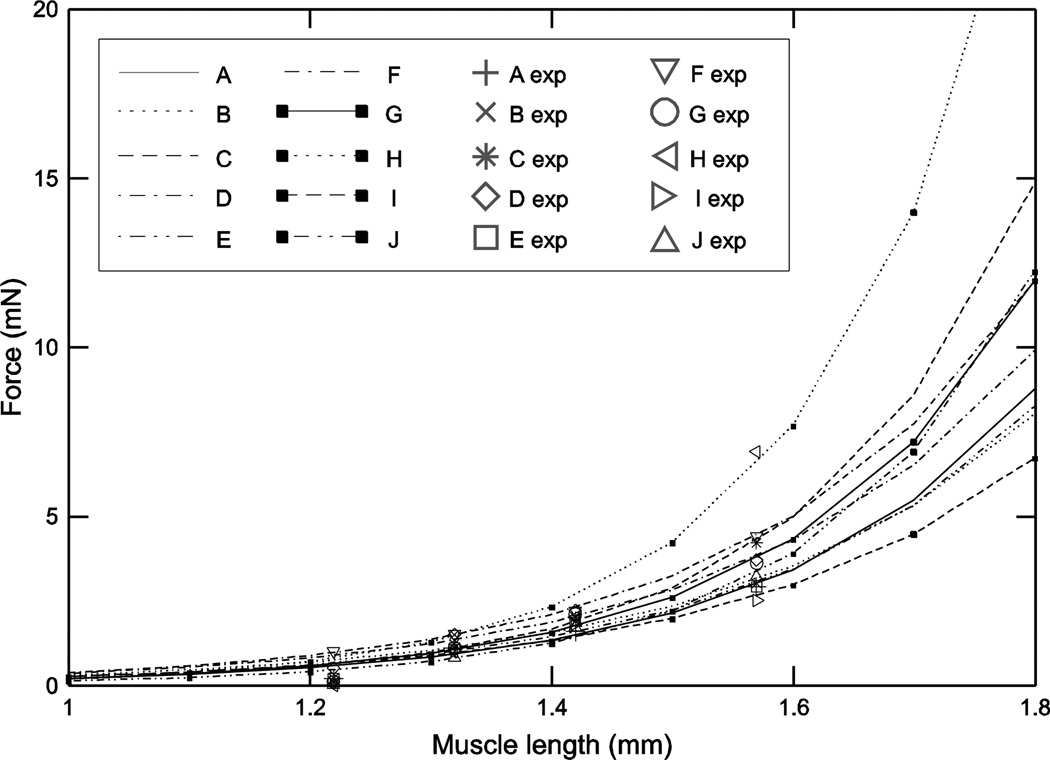
Fig. 1.
Passive steady-state force-length curves showed large inter-animal variation, particularly at long muscle lengths. Key identifies which data and curves come from which animal, and is used in all figures (2–11) showing data from multiple animals. Lines (left two columns in key) are curve fit lines, symbols (right two columns in key) are data points.

