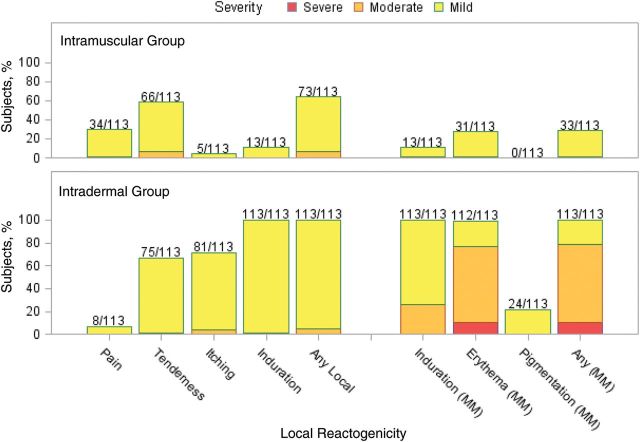
Figure 2.
Maximum injection site reactogenicity among 113 subjects in the intramuscular group and 113 subjects in the intradermal group after dose 2. Numbers above the bars represent the proportion of subjects who reported the local reaction during the 7 days after dose 2. Data represent the maximum severity of local site reactogenicity during the 7 days. For local pain, tenderness, itching, and induration, yellow denotes mild (did not interfere with activity), orange denotes moderate (some interference with daily activities), and red denotes severe (incapacitating). For local induration, erythema, and pigmentation (diameter), yellow denotes mild (<20 mm), orange denotes moderate (20–50 mm), and red denotes severe (>50 mm).

