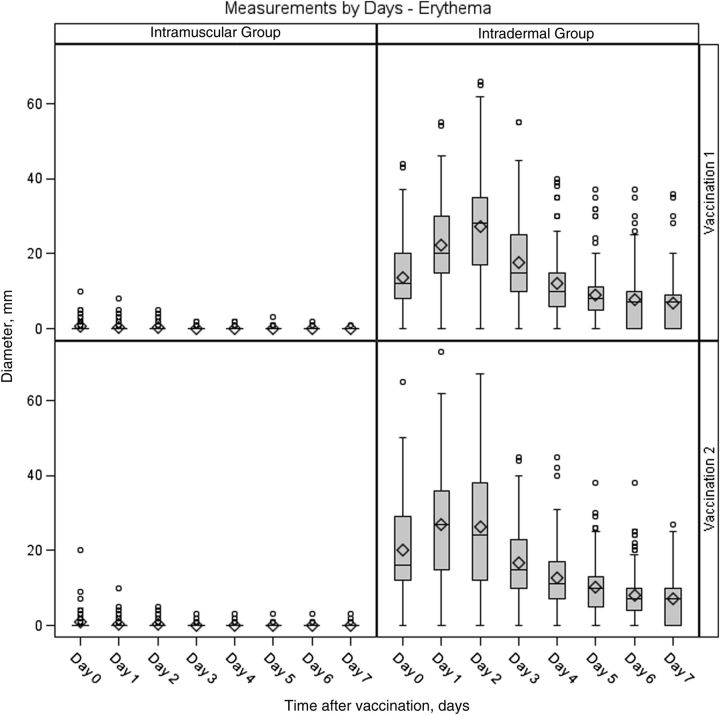
Figure 3.
Maximum diameter of erythema at the injection site among subjects in the intradermal and intramuscular groups 0–7 days after doses 1 and 2. In the box plots, the center horizontal line is drawn at the 50th percentile (median); the bottom and top edges of the box are located at the 25th and 75th percentiles, respectively; the mean value is denoted by the diamond; the vertical lines extend from the box to the 5th and 95th percentiles; and extreme values are marked with a plot symbol.

